UNITED STATES
SECURITIES AND EXCHANGE COMMISSION
WASHINGTON, D.C. 20549
FORM 10-Q
| |
|
|
| þ |
|
QUARTERLY REPORT PURSUANT TO SECTION 13 OR 15(d) OF THE SECURITIES
EXCHANGE ACT OF 1934 |
FOR THE QUARTERLY PERIOD ENDED JUNE 30, 2011
OR
| |
|
|
| o |
|
TRANSITION REPORT PURSUANT TO SECTION 13 OR 15(d) OF THE
SECURITIES EXCHANGE ACT OF 1934 |
FOR THE TRANSITION PERIOD FROM TO
COMMISSION FILE NUMBER: 001-33097
GLADSTONE COMMERCIAL CORPORATION
(Exact name of registrant as specified in its charter)
| |
|
|
|
| MARYLAND
|
|
02-0681276 |
| (State or other jurisdiction of incorporation or organization)
|
|
(I.R.S. Employer Identification No.) |
| |
|
|
| 1521 WESTBRANCH DRIVE, SUITE 200
|
|
22102 |
| MCLEAN, VIRGINIA
|
|
(Zip Code) |
| (Address of principal executive offices) |
|
|
(703) 287-5800
(Registrant’s telephone number, including area code)
Indicate by check mark whether the registrant (1) has filed all reports required to be filed by
Section 13 or 15(d) of the Securities Exchange Act of 1934 during the preceding 12 months (or for
such shorter period that the registrant was required to file such reports) and (2) has been subject
to such filing requirements for the past 90 days. Yes
þ No o
Indicate by check mark whether the registrant has submitted electronically and posted on its
corporate Web site, if any, every Interactive Data File required to be submitted and posted
pursuant to Rule 405 of Regulation S-T during the preceding 12 months (or for such shorter period
that the registrant was required to submit and post such files). Yes þ No o
Indicate by check mark whether the registrant is a large accelerated filer, an accelerated filer, a
non-accelerated filer, or a smaller reporting company. See the definitions of “large accelerated
filer,” “accelerated filer” and “smaller reporting company” in Rule 12b-2 of the Exchange Act.
(Check one):
| |
|
|
|
|
|
|
|
| Large accelerated filer o
|
|
Accelerated filer þ
|
|
Non-accelerated filer o
|
|
Smaller reporting company o |
|
|
|
|
(Do not check
if a smaller reporting company) |
|
Indicate by check mark whether the registrant is a shell company (as defined in Rule 12b-2 of the
Exchange Act). Yes o No þ
The number of shares of the registrant’s Common Stock, $0.001 par value, outstanding as of August
2, 2011 was 10,945,379.
GLADSTONE COMMERCIAL CORPORATION
FORM 10-Q FOR THE QUARTER ENDED
JUNE 30, 2011
TABLE OF CONTENTS
2
Gladstone Commercial Corporation
Consolidated Balance Sheets
(Dollars in Thousands, Except Share and Per Share Amounts)
(Unaudited)
| |
|
|
|
|
|
|
|
|
| |
|
June 30, 2011 |
|
|
December 31, 2010 |
|
ASSETS |
|
|
|
|
|
|
|
|
Real estate, at cost |
|
$ |
419,720 |
|
|
$ |
401,017 |
|
Less: accumulated depreciation |
|
|
48,537 |
|
|
|
43,659 |
|
|
|
|
|
|
|
|
Total real estate, net |
|
|
371,183 |
|
|
|
357,358 |
|
|
|
|
|
|
|
|
|
| |
Lease intangibles, net |
|
|
32,804 |
|
|
|
26,747 |
|
Cash and cash equivalents |
|
|
2,315 |
|
|
|
7,062 |
|
Restricted cash |
|
|
2,358 |
|
|
|
2,288 |
|
Funds held in escrow |
|
|
3,305 |
|
|
|
2,621 |
|
Deferred rent receivable |
|
|
11,905 |
|
|
|
10,373 |
|
Deferred financing costs, net |
|
|
3,096 |
|
|
|
3,326 |
|
Other assets |
|
|
1,050 |
|
|
|
834 |
|
|
|
|
|
|
|
|
|
|
|
|
|
|
|
|
|
TOTAL ASSETS |
|
$ |
428,016 |
|
|
$ |
410,609 |
|
|
|
|
|
|
|
|
| |
LIABILITIES AND STOCKHOLDERS’ EQUITY |
|
|
|
|
|
|
|
|
|
|
|
|
|
|
|
|
|
LIABILITIES |
|
|
|
|
|
|
|
|
Mortgage notes payable |
|
$ |
267,124 |
|
|
$ |
259,595 |
|
Borrowings under line of credit |
|
|
8,200 |
|
|
|
27,000 |
|
Deferred rent liability |
|
|
3,042 |
|
|
|
2,276 |
|
Asset retirement obligation liability |
|
|
3,140 |
|
|
|
3,063 |
|
Accounts payable and accrued expenses |
|
|
1,873 |
|
|
|
2,683 |
|
Due to Adviser (1) |
|
|
1,091 |
|
|
|
965 |
|
Other liabilities |
|
|
3,686 |
|
|
|
3,652 |
|
|
|
|
|
|
|
|
|
|
|
|
|
|
|
|
|
Total Liabilities |
|
|
288,156 |
|
|
|
299,234 |
|
|
|
|
|
|
|
|
|
|
|
|
|
|
|
|
|
STOCKHOLDERS’ EQUITY |
|
|
|
|
|
|
|
|
Redeemable preferred stock, $0.001 par value; $25 liquidation preference; |
|
|
|
|
|
|
|
|
2,300,000 shares authorized and 2,150,000 shares issued and outstanding at June 30, 2011 and December 31, 2010, respectively |
|
|
2 |
|
|
|
2 |
|
Senior common stock, $0.001 par value; 7,500,000 shares authorized and |
|
|
|
|
|
|
|
|
59,057 shares issued and outstanding at June 30, 2011 and December 31, 2010, respectively |
|
|
— |
|
|
|
— |
|
Common stock, $0.001 par value, 40,200,000 shares authorized and |
|
|
|
|
|
|
|
|
10,771,379 and 8,724,613 shares issued and outstanding at June 30, 2011 and December 31, 2010, respectively |
|
|
11 |
|
|
|
9 |
|
Additional paid in capital |
|
|
208,664 |
|
|
|
174,261 |
|
Notes receivable — employees |
|
|
(431 |
) |
|
|
(963 |
) |
Distributions in excess of accumulated earnings |
|
|
(68,386 |
) |
|
|
(61,934 |
) |
|
|
|
|
|
|
|
|
|
|
|
|
|
|
|
|
Total Stockholders’ Equity |
|
|
139,860 |
|
|
|
111,375 |
|
|
|
|
|
|
|
|
|
|
|
|
|
|
|
|
|
TOTAL LIABILITIES AND STOCKHOLDERS’ EQUITY |
|
$ |
428,016 |
|
|
$ |
410,609 |
|
|
|
|
|
|
|
|
| |
|
|
| (1)
Refer to Note 2 Related-Party Transactions |
The accompanying notes are an integral part of these consolidated financial statements.
3
Gladstone Commercial Corporation
Consolidated Statements of Operations
(Dollars in Thousands, Except Per Share Data)
(Unaudited)
| |
|
|
|
|
|
|
|
|
|
|
|
|
|
|
|
|
| |
|
For the three months ended June 30, |
|
|
For the six months ended June 30, |
|
| |
|
2011 |
|
|
2010 |
|
|
2011 |
|
|
2010 |
|
Operating revenues |
|
|
|
|
|
|
|
|
|
|
|
|
|
|
|
|
Rental income |
|
$ |
10,729 |
|
|
$ |
10,410 |
|
|
$ |
21,164 |
|
|
$ |
20,824 |
|
Interest income from mortgage note receivable |
|
|
— |
|
|
|
189 |
|
|
|
— |
|
|
|
377 |
|
Tenant recovery revenue |
|
|
87 |
|
|
|
82 |
|
|
|
170 |
|
|
|
165 |
|
|
|
|
|
|
|
|
|
|
|
|
|
|
Total operating revenues |
|
|
10,816 |
|
|
|
10,681 |
|
|
|
21,334 |
|
|
|
21,366 |
|
|
|
|
|
|
|
|
|
|
|
|
|
|
|
|
|
|
|
|
|
|
|
|
|
|
|
|
|
|
|
Operating expenses |
|
|
|
|
|
|
|
|
|
|
|
|
|
|
|
|
Depreciation and amortization |
|
|
3,475 |
|
|
|
3,390 |
|
|
|
6,845 |
|
|
|
6,712 |
|
Property operating expenses |
|
|
202 |
|
|
|
230 |
|
|
|
499 |
|
|
|
474 |
|
Due diligence expense |
|
|
131 |
|
|
|
— |
|
|
|
(8 |
) |
|
|
22 |
|
Base management fee (1) |
|
|
435 |
|
|
|
296 |
|
|
|
787 |
|
|
|
609 |
|
Incentive fee (1) |
|
|
840 |
|
|
|
829 |
|
|
|
1,672 |
|
|
|
1,675 |
|
Administration fee (1) |
|
|
260 |
|
|
|
219 |
|
|
|
516 |
|
|
|
451 |
|
General and administrative |
|
|
357 |
|
|
|
442 |
|
|
|
812 |
|
|
|
823 |
|
|
|
|
|
|
|
|
|
|
|
|
|
|
Total operating expenses before credits from Adviser |
|
|
5,700 |
|
|
|
5,406 |
|
|
|
11,123 |
|
|
|
10,766 |
|
|
|
|
|
|
|
|
|
|
|
|
|
|
|
|
|
|
|
|
|
|
|
|
|
|
|
|
|
|
|
Credit to incentive fee |
|
|
(445 |
) |
|
|
(56 |
) |
|
|
(931 |
) |
|
|
(56 |
) |
|
|
|
|
|
|
|
|
|
|
|
|
|
Total operating expenses |
|
|
5,255 |
|
|
|
5,350 |
|
|
|
10,192 |
|
|
|
10,710 |
|
|
|
|
|
|
|
|
|
|
|
|
|
|
|
|
|
|
|
|
|
|
|
|
|
|
|
|
|
|
|
Other income (expense) |
|
|
|
|
|
|
|
|
|
|
|
|
|
|
|
|
Interest income — employee loans |
|
|
9 |
|
|
|
43 |
|
|
|
19 |
|
|
|
86 |
|
Other income |
|
|
1 |
|
|
|
5 |
|
|
|
45 |
|
|
|
8 |
|
Interest expense |
|
|
(4,201 |
) |
|
|
(4,373 |
) |
|
|
(8,356 |
) |
|
|
(8,657 |
) |
|
|
|
|
|
|
|
|
|
|
|
|
|
Total other expense |
|
|
(4,191 |
) |
|
|
(4,325 |
) |
|
|
(8,292 |
) |
|
|
(8,563 |
) |
|
|
|
|
|
|
|
|
|
|
|
|
|
|
|
|
|
|
|
|
|
|
|
|
|
|
|
|
|
|
Net income |
|
|
1,370 |
|
|
|
1,006 |
|
|
|
2,850 |
|
|
|
2,093 |
|
|
|
|
|
|
|
|
|
|
|
|
|
|
|
|
|
|
|
|
|
|
|
|
|
|
|
|
|
|
|
Distributions attributable to preferred stock |
|
|
(1,024 |
) |
|
|
(1,023 |
) |
|
|
(2,047 |
) |
|
|
(2,047 |
) |
Distributions attributable to senior common stock |
|
|
(15 |
) |
|
|
— |
|
|
|
(31 |
) |
|
|
— |
|
|
|
|
|
|
|
|
|
|
|
|
|
|
Net income (loss) available to common stockholders |
|
$ |
331 |
|
|
$ |
(17 |
) |
|
$ |
772 |
|
|
$ |
46 |
|
|
|
|
|
|
|
|
|
|
|
|
|
|
|
|
|
|
|
|
|
|
|
|
|
|
|
|
|
|
|
Earnings per weighted average share of common stock |
|
|
|
|
|
|
|
|
|
|
|
|
|
|
|
|
Basic |
|
$ |
0.04 |
|
|
$ |
0.00 |
|
|
$ |
0.08 |
|
|
$ |
0.01 |
|
|
|
|
|
|
|
|
|
|
|
|
|
|
Diluted |
|
$ |
0.04 |
|
|
$ |
0.00 |
|
|
$ |
0.08 |
|
|
$ |
0.01 |
|
|
|
|
|
|
|
|
|
|
|
|
|
|
|
|
|
|
|
|
|
|
|
|
|
|
|
|
|
|
|
Weighted average shares of common stock outstanding |
|
|
|
|
|
|
|
|
|
|
|
|
|
|
|
|
Basic |
|
|
9,782 |
|
|
|
8,545 |
|
|
|
9,522 |
|
|
|
8,552 |
|
|
|
|
|
|
|
|
|
|
|
|
|
|
Diluted |
|
|
9,834 |
|
|
|
8,545 |
|
|
|
9,573 |
|
|
|
8,553 |
|
|
|
|
|
|
|
|
|
|
|
|
|
|
|
|
|
|
|
|
|
|
|
|
|
|
|
|
|
|
|
Earnings per weighted average share of senior common stock |
|
$ |
0.26 |
|
|
$ |
0.26 |
|
|
$ |
0.52 |
|
|
$ |
0.52 |
|
|
|
|
|
|
|
|
|
|
|
|
|
|
Weighted average shares of senior common stock outstanding — basic |
|
|
59 |
|
|
|
1 |
|
|
|
59 |
|
|
|
1 |
|
|
|
|
|
|
|
|
|
|
|
|
|
|
|
|
|
| (1) |
|
Refer to Note 2 Related-Party Transactions |
The accompanying notes are an integral part of these consolidated financial statements.
4
Gladstone Commercial Corporation
Consolidated Statements of Cash Flows
(Dollars in Thousands)
(Unaudited)
| |
|
|
|
|
|
|
|
|
| |
|
For the six months ended June 30, |
|
| |
|
2011 |
|
|
2010 |
|
Cash flows from operating activities: |
|
|
|
|
|
|
|
|
Net income |
|
$ |
2,850 |
|
|
$ |
2,093 |
|
Adjustments to reconcile net income to net cash
provided by operating activities: |
|
|
|
|
|
|
|
|
Depreciation and amortization |
|
|
6,845 |
|
|
|
6,712 |
|
Amortization of deferred financing costs |
|
|
456 |
|
|
|
544 |
|
Amortization of deferred rent asset and liability, net |
|
|
(335 |
) |
|
|
(348 |
) |
Amortization of discount on assumed debt |
|
|
62 |
|
|
|
— |
|
Asset retirement obligation expense |
|
|
77 |
|
|
|
75 |
|
Increase in other assets |
|
|
(215 |
) |
|
|
(963 |
) |
Increase in deferred rent liability |
|
|
1,255 |
|
|
|
— |
|
Increase in deferred rent receivable |
|
|
(715 |
) |
|
|
(849 |
) |
Decrease in accounts payable, accrued expenses, and amount due Adviser |
|
|
(684 |
) |
|
|
(478 |
) |
(Decrease) increase in other liabilities |
|
|
(36 |
) |
|
|
279 |
|
|
|
|
|
|
|
|
Net cash provided by operating activities |
|
|
9,560 |
|
|
|
7,065 |
|
|
|
|
|
|
|
|
|
|
|
|
|
|
|
|
|
Cash flows from investing activities: |
|
|
|
|
|
|
|
|
Real estate investments |
|
|
(15,778 |
) |
|
|
(575 |
) |
Leasing commissions paid |
|
|
— |
|
|
|
(7 |
) |
Receipts from lenders for reserves held in escrow |
|
|
1,143 |
|
|
|
1,016 |
|
Payments to lenders for reserves held in escrow |
|
|
(1,827 |
) |
|
|
(873 |
) |
Receipts from tenants for reserves |
|
|
1,082 |
|
|
|
1,037 |
|
Payments to tenants from reserves |
|
|
(962 |
) |
|
|
(948 |
) |
(Increase) decrease in restricted cash |
|
|
(69 |
) |
|
|
338 |
|
Deposits refunded |
|
|
— |
|
|
|
250 |
|
|
|
|
|
|
|
|
Net cash (used in) provided by investing activities |
|
|
(16,411 |
) |
|
|
238 |
|
|
|
|
|
|
|
|
|
|
|
|
|
|
|
|
|
Cash flows from financing activities: |
|
|
|
|
|
|
|
|
Proceeds from issuance of equity |
|
|
36,603 |
|
|
|
30 |
|
Offering costs |
|
|
(2,198 |
) |
|
|
(5 |
) |
Principal repayments on mortgage notes payable |
|
|
(4,454 |
) |
|
|
(1,308 |
) |
Principal repayments on employee notes receivable |
|
|
532 |
|
|
|
44 |
|
Borrowings from line of credit |
|
|
27,374 |
|
|
|
13,400 |
|
Repayments on line of credit |
|
|
(46,174 |
) |
|
|
(10,300 |
) |
Decrease in security deposits |
|
|
(51 |
) |
|
|
(427 |
) |
Payments for deferred financing costs |
|
|
(226 |
) |
|
|
(61 |
) |
Distributions paid for common, senior common and preferred |
|
|
(9,302 |
) |
|
|
(8,460 |
) |
|
|
|
|
|
|
|
Net cash provided by (used in) financing activities |
|
|
2,104 |
|
|
|
(7,087 |
) |
|
|
|
|
|
|
|
|
|
|
|
|
|
|
|
|
Net (decrease) increase in cash and cash equivalents |
|
|
(4,747 |
) |
|
|
216 |
|
|
|
|
|
|
|
|
|
|
Cash and cash equivalents, beginning of period |
|
|
7,062 |
|
|
|
3,096 |
|
|
|
|
|
|
|
|
|
|
|
|
|
|
|
|
|
Cash and cash equivalents, end of period |
|
$ |
2,315 |
|
|
$ |
3,312 |
|
|
|
|
|
|
|
|
|
|
|
|
|
|
|
|
|
NON-CASH OPERATING, INVESTING AND FINANCING INFORMATION |
|
|
|
|
|
|
|
|
|
|
|
|
|
|
|
|
|
Fixed rate debt assumed in connection with acquisitions |
|
$ |
11,921 |
|
|
$ |
— |
|
|
|
|
|
|
|
|
| |
Forfeiture of common stock in satisfaction of employee note receivable |
|
$ |
— |
|
|
$ |
244 |
|
|
|
|
|
|
|
|
The accompanying notes are an integral part of these consolidated financial statements.
5
Gladstone Commercial Corporation
Notes to Unaudited Consolidated Financial Statements
(Dollars in Thousands, Except Share and per Share Data or Unless Otherwise Indicated)
1. Organization and Significant Accounting Policies
Gladstone Commercial Corporation (the “Company”) was incorporated on February 14, 2003 under the
General Corporation Law of Maryland. The Company operates in a manner so as to qualify as a real
estate investment trust (“REIT”) for federal income tax purposes and exists primarily for the
purposes of engaging in the business of investing in real estate properties net leased to
creditworthy entities and making mortgage loans to creditworthy entities. Subject to certain
restrictions and limitations, the business of the Company is managed by Gladstone Management
Corporation, a Delaware corporation (the “Adviser”).
Subsidiaries
The Company conducts substantially all of its operations through a subsidiary, Gladstone Commercial
Limited Partnership, a Delaware limited partnership (the “Operating Partnership”). As the Company
currently owns all of the general and limited partnership interests of the Operating Partnership
through GCLP Business Trust I and II, as discussed in more detail below, the financial position and
results of operations of the Operating Partnership are consolidated with those of the Company.
Gladstone Commercial Lending, LLC, a Delaware limited liability company (“Gladstone Commercial
Lending”) and a subsidiary of the Company, was created to conduct all operations related to real
estate mortgage loans of the Company. As the Operating Partnership currently owns all of the
membership interests of Gladstone Commercial Lending, the financial position and results of
operations of Gladstone Commercial Lending are consolidated with those of the Company.
Gladstone Commercial Advisers, Inc., a Delaware corporation (“Commercial Advisers”) and a
subsidiary of the Company, is a taxable REIT subsidiary (“TRS”), which was created to collect all
non-qualifying income related to the Company’s real estate portfolio. There have been no such fees
earned to date. Since the Company owns 100% of the voting securities of Commercial Advisers, the
financial position and results of operations of Commercial Advisers are consolidated with those of
the Company.
GCLP Business Trust I and GCLP Business Trust II, each a subsidiary and business trust of the
Company, were formed under the laws of the Commonwealth of Massachusetts on December 28, 2005. The
Company transferred its 99% limited partnership interest in the Operating Partnership to GCLP
Business Trust I in exchange for 100 trust shares. Gladstone Commercial Partners, LLC transferred
its 1% general partnership interest in the Operating Partnership to GCLP Business Trust II in
exchange for 100 trust shares.
Interim Financial Information
Interim financial statements of the Company are prepared in accordance with accounting principles
generally accepted in the United States of America (“GAAP”) for interim financial information and
pursuant to the requirements for reporting on Form 10-Q and in accordance with Article 10 of
Regulation S-X. Accordingly, certain disclosures accompanying annual financial statements prepared
in accordance with GAAP are omitted. In the opinion of the Company’s management, all adjustments,
consisting solely of normal recurring accruals, necessary for the fair statement of financial
statements for the interim period have been included. The interim financial statements and notes
thereto should be read in conjunction with the financial statements and notes thereto included in
the Company’s Form 10-K for the year ended December 31, 2010, as filed with the Securities and
Exchange Commission on March 8, 2011.
Out of Period Adjustment
During the three months ended March, 31 2011, the Company recorded adjustments to due diligence
expense, depreciation and amortization expense and to certain balance sheet accounts in connection
with the property the Company acquired in December 2010. As a result of these errors, the Company
understated net income by $250 for the year ended December 31, 2010, or $0.03 per share. The
Company
6
concluded that these adjustments were not material to the 2010 results of operations nor are they
expected to be material to the full year 2011 results. As such, these adjustments were recorded
during the three months ended March 31, 2011.
Use of Estimates
The preparation of financial statements in conformity with GAAP requires management to make
estimates and assumptions that affect the reported amounts of assets and liabilities and disclosure
of contingent assets and liabilities at the date of the financial statements and the reported
amounts of revenues and expenses during the reporting period. Actual results could materially
differ from those estimates.
Reclassifications
Certain amounts on the consolidated statements of operations from prior years’ financial statements
have been reclassified to conform to the current year presentation. These reclassifications had no
effect on previously reported net income or stockholders’ equity.
Investments in Real Estate
The Company records investments in real estate at cost and capitalizes improvements and
replacements when they extend the useful life or improve the efficiency of the asset. The Company
expenses costs of repairs and maintenance as such costs are incurred. The Company computes
depreciation using the straight-line method over the estimated useful life or 39 years for
buildings and improvements, 5 to 7 years for equipment and fixtures, and the shorter of the useful
life or the remaining lease term for tenant improvements and leasehold interests.
The Company accounts for its acquisitions of real estate in accordance with Accounting Standards
Codification (“ASC”) 805, “Business Combinations,” which requires that the purchase price of real
estate be recorded at fair value and allocated to the acquired tangible assets and liabilities,
consisting of land, building, tenant improvements, long-term debt and identified intangible assets
and liabilities, consisting of the value of above-market and below-market leases, the value of
in-place leases, the value of unamortized lease origination costs, the value of tenant
relationships and the value of capital lease obligations, based in each case on their fair values.
ASC 805 also requires that all expenses related to the acquisition be expensed as incurred, rather
than capitalized into the cost of the acquisition as had been the previous accounting.
Management’s estimates of value are made using methods similar to those used by independent
appraisers (e.g., discounted cash flow analysis). Factors considered by management in its analysis
include an estimate of carrying costs during hypothetical expected lease-up periods considering
current market conditions and costs to execute similar leases. The Company also considers
information obtained about each property as a result of its pre-acquisition due diligence,
marketing and leasing activities in estimating the fair value of the tangible and intangible assets
and liabilities acquired. In estimating carrying costs, management also includes real estate taxes,
insurance and other operating expenses and estimates of lost rentals at market rates during the
hypothetical expected lease-up periods, which primarily range from nine to eighteen months,
depending on specific local market conditions. Management also estimates costs to execute similar
leases, including leasing commissions, legal and other related expenses to the extent that such
costs are not already incurred in connection with a new lease origination as part of the
transaction.
The Company allocates purchase price to the fair value of the tangible assets of an acquired
property by valuing the property as if it were vacant. The “as-if-vacant” value is allocated to
land, building and tenant improvements based on management’s determination of the relative fair
values of these assets. Real estate depreciation expense on these tangible assets, was $2,488 and
$4,878 for the three and six months ended June 30, 2011, respectively, and $2,384 and $4,775 for
the three and six months ended June 30, 2010, respectively.
7
Above-market and below-market in-place lease values for owned properties are recorded based on the
present value (using an interest rate which reflects the risks associated with the leases acquired)
of the difference between (i) the contractual amounts to be paid pursuant to the in-place leases
and (ii) management’s estimate of fair market lease rates for the corresponding in-place leases,
measured over a period equal to the remaining non-cancelable term of the lease. The capitalized
above-market lease values, included in the accompanying balance sheet as part of deferred rent
receivable, are amortized as a reduction of rental income over the remaining non-cancelable terms
of the respective leases. Total amortization related to above-market lease values was $91 and $154
for the three and six months ended June 30, 2011, and $63 and $127 for the three and six months
ended June 30, 2010, respectively. The capitalized below-market lease values, included in the
accompanying consolidated balance sheet as deferred rent liability, are amortized as an increase to
rental income over the remaining non-cancelable terms of the respective leases. Total amortization
related to below-market lease values was $250 and $489 for the three and six months ended June 30,
2011, and $231 and $474 for the three and six months ended June 30, 2010, respectively.
The total amount of the remaining intangible assets acquired, which consist of in-place lease
values, unamortized lease origination costs, and customer relationship intangible values, are
allocated based on management’s evaluation of the specific characteristics of each tenant’s lease
and the Company’s overall relationship with that respective tenant. Characteristics to be
considered by management in allocating these values include the nature and extent of our existing
business relationships with the tenant, growth prospects for developing new business with the
tenant, the tenant’s credit quality and the Company’s expectations of lease renewals (including
those existing under the terms of the lease agreement), among other factors.
The value of in-place leases and unamortized lease origination costs are amortized to expense over
the remaining term of the respective leases, which generally range from 10 to 15 years. The value
of customer relationship intangibles, which is the benefit to the Company resulting from the
likelihood of an existing tenant renewing its lease, are amortized to expense over the remaining
term and any anticipated renewal periods in the respective leases, but in no event does the
amortization period for intangible assets exceed the remaining depreciable life of the building.
Should a tenant terminate its lease, the unamortized portion of the above-market and below-market
lease values, in-place lease values, unamortized lease origination costs and customer relationship
intangibles will be immediately charged to the related income or expense. Total amortization
expense related to these intangible assets, was $987 and $1,967 for the three and six months ended
June 30, 2011, respectively, and $1,006 and $1,938 for the three and six months ended June 30,
2010, respectively.
Impairment
The Company accounts for the impairment of real estate, including intangible assets, in accordance
with ASC 360-10-35, “Property, Plant, and Equipment,” which requires the Company to periodically
review the carrying value of each property to determine if circumstances indicate impairment in the
carrying value of the investment exist or that depreciation periods should be modified. If
circumstances support the possibility of impairment, the Company prepares a projection of the
undiscounted future cash flows, without interest charges, of the specific property and determines
if the investment in such property is recoverable. If impairment is indicated, the Company will
write down the carrying value of the property to its estimated fair value.
In light of current economic conditions, the Company evaluates its entire portfolio each quarter
for any impairment indicators and performed an impairment analysis on those select properties that
had an indication of impairment. In performing the analysis, the Company considered such factors
as the tenants’ payment history and financial condition, the likelihood of lease renewal, business
conditions in the industry in which the tenants operate and whether the fair value of the real
estate has decreased. The Company concluded that none of its properties were impaired, and will
continue to monitor its portfolio for any indicators that may change this conclusion. There have
been no impairments recognized on real estate assets in the Company’s history.Cash and Cash
Equivalents
8
The Company considers cash equivalents to be all short-term, highly-liquid investments that are
both readily convertible to cash and have a maturity of three months or less at the time of
purchase, except that any such investments purchased with funds held in escrow or similar accounts
are classified as restricted cash. Items classified as cash equivalents include money-market
deposit accounts. All of the Company’s cash and cash equivalents at June 30, 2011 were held in the
custody of three financial institutions, and the Company’s balance at times may exceed federally
insurable limits.
Restricted Cash
Restricted cash consists of security deposits and receipts from tenants for reserves. These funds
will be released to the tenants upon completion of agreed upon tasks, as specified in the lease
agreements, mainly consisting of maintenance and repairs on the buildings and upon receipt by the
Company of evidence of insurance and tax payments. For purposes of the statements of cash flows,
changes in restricted cash caused by changes in reserves held for tenants are shown as investing
activities. Changes in restricted cash caused by changes in security deposits are reflected in cash
from financing activities.
Funds Held in Escrow
Funds held in escrow consist of funds held by certain of the Company’s lenders for properties held
as collateral by these lenders. These funds will be released to the Company upon completion of
agreed upon tasks, as specified in the mortgage agreements, mainly consisting of maintenance and
repairs on the buildings, and when evidence of insurance and tax payments has been submitted to the
lenders.
Deferred Financing Costs
Deferred financing costs consist of costs incurred to obtain financing, including legal fees,
origination fees and administrative fees. The costs are deferred and amortized using the
straight-line method, which approximates the effective interest method, over the term of the
secured financing. The Company made payments of $216 and $226 for deferred financing costs during
the three and six months ended June 30, 2011, respectively, and $11 and $61 for deferred financing
cost during the three and six months ended June 30, 2010, respectively. Total amortization expense
related to deferred financing costs is included in interest expense and was $225 and $456 for the
three and six months ended June 30, 2011, respectively, and $272 and $544 for the three and six
months ended June 30, 2010, respectively.
Obligation Under Capital Lease
In conjunction with the Company’s acquisition of a building in Fridley, Minnesota in February 2008,
the Company acquired a ground lease on the parking lot of the building, which had a purchase
obligation to acquire the land under the ground lease at the end of the term in April 2014 for
$300. In accordance with ASC 840-10-25, “Leases,” the Company accounted for the ground lease as a
capital lease and recorded the corresponding present value of the obligation under the capital
lease. The Company recorded total interest expense related to the accretion of the capital lease
obligation of $3 and $6 for each of the three and six months ended June 30, 2011 and 2010,
respectively.
Revenue Recognition
Rental revenue includes rents that each tenant pays in accordance with the terms of its respective
lease reported evenly over the non-cancelable term of the lease. Most of the Company’s leases
contain rental increases at specified intervals. The Company recognizes such revenues on a
straight-line basis. Deferred rent receivable in the accompanying consolidated balance sheet
includes the cumulative difference between rental revenue, as recorded on a straight line basis,
and rents received from the tenants in accordance with the lease terms, along with the capitalized
above-market in-place lease values of certain acquired properties. Accordingly, the Company
determines, in its judgment, to what extent the deferred rent receivable applicable to each
specific tenant is collectable. The Company reviews deferred rent receivable, as it relates to
straight line rents, on a quarterly basis and takes into consideration the tenant’s payment
history, the financial condition of the tenant, business conditions in the industry in which the
tenant
9
operates and economic conditions in the geographic area in which the property is located. In the
event that the collectability of deferred rent with respect to any given tenant is in doubt, the
Company records an allowance for uncollectable accounts or records a direct write-off of the
specific rent receivable. No such reserves or direct write-offs have been recorded as of June 30,
2011.
Tenant recovery revenue includes payments from tenants as reimbursements for franchise taxes,
management fees, insurance, and ground lease payments. The Company recognizes tenant recovery
revenue in the same periods that it incurs the related expenses.
Income Taxes
The Company has operated and intends to continue to operate in a manner that will allow it to
qualify as a REIT under the Internal Revenue Code of 1986, as amended, and, accordingly, will not
be subject to federal income taxes on amounts distributed to stockholders (except income from
foreclosure property), provided that it distributes at least 90% of its REIT taxable income to its
stockholders and meets certain other conditions. To the extent that the Company satisfies the
distribution requirement but distributes less than 100% of its taxable income, the Company will be
subject to federal corporate income tax on its undistributed income.
Commercial Advisers is a wholly-owned TRS that is subject to federal and state income taxes. Though
Commercial Advisers has had no activity to date, the Company would account for any future income
taxes in accordance with the provisions of ASC 740, “Income Taxes.” Under ASC 740-10-25, the
Company accounts for income taxes using the asset and liability method under which deferred tax
assets and liabilities are recognized for the future tax consequences attributable to differences
between the financial statement carrying amounts of existing assets and liabilities and their
respective tax bases.
Asset Retirement Obligations
ASC 410, “Asset Retirement and Environmental Obligation,” requires an entity to recognize a
liability for a conditional asset retirement obligation when incurred if the liability can be
reasonably estimated. ASC 410-20-20 clarifies that the term “Conditional Asset Retirement
Obligation” refers to a legal obligation (pursuant to existing laws or by contract) to perform an
asset retirement activity in which the timing and/or method of settlement are conditional on a
future event that may or may not be within the control of the entity. ASC 410-20-25-6 clarifies
when an entity would have sufficient information to reasonably estimate the fair value of an asset
retirement obligation. The Company has accrued a liability and corresponding increase to the cost
of the related properties for disposal related to all properties constructed prior to 1985 that
have, or may have, asbestos present in the building. The liabilities are accreted over the life of
the leases for the respective properties. There were no liabilities accrued during the six months
ended June 30, 2011 and 2010, as the properties acquired during these periods were constructed
after 1985. The Company also recorded expenses of $39 and $77 during the three and six months
ended June 30, 2011 respectively, and $38 and $75 during the three and six months ended June 30,
2010, respectively, related to the accretion of the obligation.
Stock Issuance Costs
The Company accounts for stock issuance costs in accordance with SEC Staff Accounting Bulletin
(“SAB”) Topic 5.A, which states that incremental costs directly attributable to a proposed or
actual offering of securities should be deferred and charged against the gross proceeds of the
offering. Accordingly, the Company records costs incurred related to its ongoing equity offerings
to other assets on its consolidated balance sheet and ratably applies these amounts to the cost of
equity as stock is issued. If an equity offering is subsequently terminated and there are amounts
remaining in other assets that have not been allocated to the cost of the offering, the remaining
amounts are recorded as an expense on the consolidated statement of operations.
10
2. Related-Party Transactions
The Company is externally managed pursuant to contractual arrangements with its Adviser and
Gladstone Administration, LLC (the “Administrator”), which collectively employ all of the Company’s
personnel and pay their salaries, benefits, and general expenses directly. The Company has an
advisory agreement with its Adviser (the “Advisory Agreement”) and an administration agreement with
its Administrator (the “Administration Agreement”). The management services and administrative fees
under the Advisory and Administration Agreements are described below. As of June 30, 2011 and
December 31, 2010, respectively, $1,091 and $965 were due to the Adviser.
Advisory Agreement
The Advisory Agreement provides for an annual base management fee equal to 2% of the Company’s
total stockholders’ equity, less the recorded value of any preferred stock (“common stockholders’
equity”), and an incentive fee based on funds from operations (“FFO”). For the three and six months
ended June 30, 2011 the Company recorded a base management fee of $435 and $787, respectively, and
for the three and six months ended June 30, 2010, the Company recorded a base management fee of
$296 and $609, respectively.
For purposes of calculating the incentive fee, FFO includes any realized capital gains and capital
losses, less any distributions paid on preferred stock and senior common stock, but FFO does not
include any unrealized capital gains or losses. The incentive fee rewards the Adviser if the
Company’s quarterly FFO, before giving effect to any incentive fee (“pre-incentive fee FFO”),
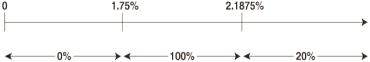
exceeds 1.75%, or 7% annualized (the “hurdle rate”), of total common stockholders’ equity. The
Adviser receives 100% of the amount of the pre-incentive fee FFO that exceeds the hurdle rate, but
is less than 2.1875% of the Company’s common stockholders’ equity. The Adviser also receives an
incentive fee of 20% of the amount of the Company’s pre-incentive fee FFO that exceeds 2.1875% of
common stockholders’ equity.
For the three and six months ended June 30, 2011, the Company recorded an incentive fee of $840 and
$1,672, respectively, offset by a credit related to an unconditional and irrevocable voluntary
waiver issued by the Adviser of $445 and $931, respectively, resulting in a net incentive fee for
the three and six months ended June 30, 2011, of $395 and $741, respectively. For the three and six
months ended June 30, 2010, the Company recorded an incentive fee of $829 and $1,675, respectively,
offset by a credit related to an unconditional and irrevocable voluntary waiver issued by the
Adviser of $56 and $56, respectively, resulting in a net incentive fee for the three and six months
ended June 30, 2010, of $773 and $1,619, respectively. The Board of Directors of the Company
accepted the Adviser’s offer to waive on a quarterly basis a portion of the incentive fee for the
three and six months ended June 30, 2011 and 2010, respectively in order to support the current
level of distributions to the Company’s stockholders. This waiver may not be recouped by the
Adviser in the future.
Administration Agreement
Pursuant to the Administration Agreement, the Company pays for its allocable portion of the
Administrator’s overhead expenses in performing its obligations to the Company, including, but not
limited to, rent and the salaries and benefits of its personnel, including its chief financial
officer, chief compliance officer, internal counsel, treasurer, investor relations and their
respective staffs. The Company’s allocable portion of expenses is derived by multiplying the
Administrator’s total allocable expenses by the percentage of the Company’s total assets at the
beginning of each quarter in comparison to the total assets of all companies managed by the Adviser
under similar agreements. For the three and six months ended June 30, 2011, the Company recorded an
administration fee of $260 and $516, respectively, and for the three and six months ended June 30,
2010, the Company recorded an administration fee of $219 and $451, respectively.
11
Dealer Manager Agreement
In connection with the offering of the Company’s Senior Common Stock, see Note 6, “Stockholders’
Equity,” for further details, the Company entered into a Dealer Manager Agreement, dated March 25,
2011 (the “Dealer Manager Agreement”), with Gladstone Securities, LLC (the “Dealer Manager”),
pursuant to which the Dealer Manager agreed to act as the Company’s exclusive dealer manager in
connection with the offering. The Dealer Manager is an affiliate of the Company, as its parent
company is controlled by Mr. David Gladstone, the Company’s Chairman and Chief Executive Officer.
Pursuant to the terms of the Dealer Manager Agreement, the Dealer Manager is entitled to receive a
sales commission in the amount of 7.0% of the gross proceeds of the shares of Senior Common Stock
sold, plus a dealer manager fee in the amount of 3.0% of the gross proceeds of the shares of Senior
Common Stock sold. The Dealer Manager, in its sole and absolute discretion, may re-allow all of its
selling commissions attributable to a participating broker-dealer and may also re-allow a portion
of its Dealer Manager fee earned in respect of the proceeds generated by the participating
broker-dealer to any participating broker-dealer as a non-accountable marketing allowance. In
addition, the Company has agreed to indemnify the Dealer Manager against various liabilities,
including certain liabilities arising under the federal securities laws. The company has not made
any payments to date to the Dealer Manager pursuant to this agreement.
3. Earnings per Share of Common Stock
The following tables set forth the computation of basic and diluted earnings per share of common
stock for the three and six months ended June 30, 2011 and 2010. The Company computed basic
earnings per share for the three and six months ended June 30, 2011 and 2010 using the weighted
average number of shares outstanding during the periods. Diluted earnings per share for the three
and six months ended June 30, 2011 and 2010, reflects additional shares of common stock, related to
our convertible senior common stock, that would have been outstanding if dilutive potential shares
of common stock had been issued, as well as an adjustment to net income available to common
stockholders as applicable to common stockholders that would result from their assumed issuance.
| |
|
|
|
|
|
|
|
|
|
|
|
|
|
|
|
|
| |
|
For the three months ended June 30, |
|
|
For the six months ended June 30, |
|
| |
|
2011 |
|
|
2010 |
|
|
2011 |
|
|
2010 |
|
Calculation of basic earnings per share of common stock: |
|
|
|
|
|
|
|
|
|
|
|
|
|
|
|
|
|
|
|
|
|
|
|
|
|
|
|
|
|
|
|
|
|
Net income (loss) available to common stockholders |
|
$ |
331 |
|
|
$ |
(17 |
) |
|
$ |
772 |
|
|
$ |
46 |
|
|
|
|
|
|
|
|
|
|
|
|
|
|
|
|
|
|
Denominator for basic weighted average shares of common stock |
|
|
9,782 |
|
|
|
8,545 |
|
|
|
9,522 |
|
|
|
8,552 |
|
|
|
|
|
|
|
|
|
|
|
|
|
|
|
|
|
|
Basic earnings per share of common stock |
|
$ |
0.04 |
|
|
$ |
0.00 |
|
|
$ |
0.08 |
|
|
$ |
0.01 |
|
|
|
|
|
|
|
|
|
|
|
|
|
|
|
|
|
|
|
|
|
|
|
|
|
|
|
|
|
|
|
Calculation of diluted earnings per share of comon stock: |
|
|
|
|
|
|
|
|
|
|
|
|
|
|
|
|
|
|
|
|
|
|
|
|
|
|
|
|
|
|
|
|
|
Net income (loss) available to common stockholders |
|
$ |
331 |
|
|
$ |
(17 |
) |
|
$ |
772 |
|
|
$ |
46 |
|
Add: Income impact of assumed conversion of senior common stock |
|
|
15 |
|
|
|
— |
|
|
|
31 |
|
|
|
— |
|
|
|
|
|
|
|
|
|
|
|
|
|
|
Net income (loss) available to common stockholders plus assumed conversions |
|
$ |
346 |
|
|
$ |
(17 |
) |
|
$ |
803 |
|
|
$ |
46 |
|
|
|
|
|
|
|
|
|
|
|
|
|
|
|
|
|
|
Denominator for basic weighted average shares of common stock |
|
|
9,782 |
|
|
|
8,545 |
|
|
|
9,522 |
|
|
|
8,552 |
|
Effect of convertible senior common stock |
|
|
52 |
|
|
|
— |
(1) |
|
|
52 |
|
|
|
1 |
|
|
|
|
|
|
|
|
|
|
|
|
|
|
Denominator for diluted weighted average shares of common stock |
|
|
9,834 |
|
|
|
8,545 |
|
|
|
9,574 |
|
|
|
8,553 |
|
|
|
|
|
|
|
|
|
|
|
|
|
|
|
|
|
|
|
|
|
|
|
|
|
|
|
|
|
|
|
Diluted earnings per share of common stock |
|
$ |
0.04 |
|
|
$ |
0.00 |
|
|
$ |
0.08 |
|
|
$ |
0.01 |
|
|
|
|
|
|
|
|
|
|
|
|
|
|
|
|
|
| (1) |
|
The convertible senior common stock was excluded from the calculation of diluted earnings per share for the three months ended June 30, 2010 because it was anti-dilutive. |
12
4. Real Estate and Intangible Assets
Real Estate
The following table sets forth the components of the Company’s investments in real estate,
including capitalized leases, as of June 30, 2011 and December 31, 2010:
| |
|
|
|
|
|
|
|
|
| |
|
June 30, 2011 |
|
|
December 31, 2010 |
|
Real estate: |
|
|
|
|
|
|
|
|
Land |
|
$ |
58,146 |
(1) |
|
$ |
55,158 |
(1) |
Building and improvements |
|
|
349,399 |
|
|
|
335,576 |
|
Tenant improvements |
|
|
12,175 |
|
|
|
10,283 |
|
Accumulated depreciation |
|
|
(48,537 |
) |
|
|
(43,659 |
) |
|
|
|
|
|
|
|
Real estate, net |
|
$ |
371,183 |
|
|
$ |
357,358 |
|
|
|
|
|
|
|
|
|
| (1) Includes land held under a capital lease carried at $1,100. |
During the six months ended June 30, 2011, the Company acquired two properties, which are
summarized below:
On April 4, 2011, the Company acquired a 60,000 square foot office building located in Hickory,
North Carolina for $10,650, excluding related acquisition expenses of $59. The Company funded this
acquisition using borrowings from its line of credit. At closing, the Company was assigned the
triple net lease with Fiserv Solutions, Inc., which has a remaining term of approximately nine
years. The tenant has two options to extend the lease for additional periods of five years each.
The lease provides for prescribed rent escalations over the life of the lease, with annualized
straight line rents of $1,100.
On June 20, 2011, the Company acquired a 78,421 square foot office building located in Springfield,
Missouri for $15,850, excluding related acquisition expenses of $57. The Company funded this
acquisition through a combination of borrowings from its line of credit and the assumption of
$11,584 of mortgage debt on the property. At closing, the Company was assigned the existing triple
net lease with T-Mobile USA, Inc., which has a remaining term of approximately ten years. The
tenant has three options to extend the lease for additional periods of five years each. The lease
provides for prescribed rent escalations over the life of the lease, with annualized straight line
rents of $1,422.
13
In accordance with ASC 805 the Company allocated the purchase price of the properties acquired
during the six months ended June 30, 2011 as follows:
14
| |
|
|
|
|
|
|
|
|
|
|
|
|
|
|
|
|
|
|
|
|
|
|
|
|
|
|
|
|
|
|
|
|
|
|
|
|
|
|
|
|
| |
|
|
|
|
|
|
|
|
|
|
|
|
|
|
|
|
|
|
|
|
|
|
|
|
|
|
|
|
|
Carrying Value |
|
|
|
|
|
|
|
| |
|
|
|
|
|
|
|
|
|
Tenant |
|
|
|
|
|
|
|
|
|
|
Customer |
|
|
Above Market |
|
|
of Assumed |
|
|
Premium on |
|
|
Total Purchase |
|
| |
|
Land |
|
|
Building |
|
|
Improvements |
|
|
In-place Leases |
|
|
Leasing Costs |
|
|
Relationships |
|
|
Leases |
|
|
Debt |
|
|
Assumed Debt |
|
|
Price |
|
Hickory, North Carolina |
|
$ |
1,163 |
|
|
$ |
5,567 |
|
|
$ |
1,038 |
|
|
$ |
736 |
|
|
$ |
559 |
|
|
$ |
616 |
|
|
$ |
971 |
|
|
$ |
— |
|
|
$ |
— |
|
|
$ |
10,650 |
|
Springfield, Missouri (1) |
|
|
1,700 |
|
|
|
11,626 |
|
|
|
413 |
|
|
|
1,174 |
|
|
|
572 |
|
|
|
702 |
|
|
|
— |
|
|
|
11,583 |
|
|
|
(337 |
) |
|
|
15,850 |
|
|
|
|
|
|
|
|
|
|
|
|
|
|
|
|
|
|
|
|
|
|
|
|
|
|
|
|
|
|
|
|
|
|
$ |
2,863 |
|
|
$ |
17,193 |
|
|
$ |
1,451 |
|
|
$ |
1,910 |
|
|
$ |
1,131 |
|
|
$ |
1,318 |
|
|
$ |
971 |
|
|
$ |
11,583 |
|
|
$ |
(337 |
) |
|
$ |
26,500 |
|
|
|
|
|
|
|
|
|
|
|
|
|
|
|
|
|
|
|
|
|
|
|
|
|
|
|
|
|
|
|
|
|
|
|
| (1) |
|
The Company paid $4.3 million in cassh for this property, the remaining $11.6 million was funded with the assumed mortgaged debt. |
The weighted average amortization period for the intangible assets acquired during the six months
ended June 30, 2011, were as follows:
| |
|
|
|
|
| Intangible assets |
|
Years |
In-place leases |
|
|
9.4 |
|
Leasing costs |
|
|
9.4 |
|
Customer relationships |
|
|
17.5 |
|
Above market leases |
|
|
8.8 |
|
|
|
|
|
|
All intangible assets |
|
|
11.9 |
|
|
|
|
|
|
Future operating lease payments from tenants under non-cancelable leases, excluding tenant
reimbursement of expenses, for the remainder of 2011 and each of the five succeeding fiscal years
and thereafter is as follows:
| |
|
|
|
|
| |
|
Tenant |
| Year |
|
Lease Payments |
Six months ending December 31, 2011 |
|
$ |
21,601 |
|
2012 |
|
|
42,287 |
|
2013 |
|
|
37,936 |
|
2014 |
|
|
33,884 |
|
2015 |
|
|
29,865 |
|
2016 |
|
|
25,423 |
|
Thereafter |
|
|
164,174 |
|
In accordance with the lease terms, substantially all tenant expenses are required to be paid by
the tenant; however, the Company would be required to pay property taxes on the respective
properties, and ground lease payments on the property located in Tulsa, Oklahoma, in the event the
tenant fails to pay them. The total annualized property taxes for all properties held by the
Company at June 30, 2011 was $6,900, and the total annual ground lease payments on the property
located in Tulsa, Oklahoma was $153.
On January 31, 2011, the Company extended the lease with its tenant occupying its properties
located in Decatur, Georgia, Lawrenceville, Georgia, Snellville, Georgia, Covington, Georgia, and
Conyers, Georgia. The lease covering all of these properties was extended for an additional five
year period, thereby extending the lease until December 2031. The lease was originally set to
expire in December 2026. The lease provides for prescribed rent escalations over the life of the
lease, with annualized straight line rents of $1,616. Furthermore, the lease grants the tenant
four options to extend the lease for a period of five years each. In connection with the extension
of the lease and the modification of certain terms under the lease, the tenant paid $750 to the
Company.
On May 15, 2011, the Company re-leased its previously vacant building located in South Hadley,
Massachusetts for a period of six months, and the tenant has a three-month extension option. The
lease provides for rent over the term of $101.
On June 23, 2011, the Company extended the lease with its tenant occupying its properties located
in Angola, Indiana and Rock Falls, Illinois. The lease covering these properties was extended for
an additional three year period, thereby extending the lease until August 2023. The lease was
originally set to expire in August 2020. The lease provides for prescribed rent escalations over
the life of the lease, with annualized straight line rents of $345. Furthermore, the lease grants
the tenant three options to extend the lease for a period of five years each.
15
Intangible Assets
The following table summarizes the value of intangible assets and the accumulated amortization for
each intangible asset class:
| |
|
|
|
|
|
|
|
|
|
|
|
|
|
|
|
|
| |
|
June 30, 2011 |
|
|
December 31, 2010 |
|
| |
|
|
|
|
|
Accumulated |
|
|
|
|
|
|
Accumulated |
|
| |
|
Lease Intangibles |
|
|
Amortization |
|
|
Lease Intangibles |
|
|
Amortization |
|
In-place leases |
|
$ |
21,879 |
|
|
$ |
(9,265 |
) |
|
$ |
17,011 |
|
|
$ |
(8,362 |
) |
Leasing costs |
|
|
12,126 |
|
|
|
(5,155 |
) |
|
|
10,764 |
|
|
|
(4,685 |
) |
Customer relationships |
|
|
19,430 |
|
|
|
(6,211 |
) |
|
|
17,636 |
|
|
|
(5,617 |
) |
|
|
|
|
|
|
|
|
|
|
|
|
|
|
|
$ |
53,435 |
|
|
$ |
(20,631 |
) |
|
$ |
45,411 |
|
|
$ |
(18,664 |
) |
|
|
|
|
|
|
|
|
|
|
|
|
|
The estimated aggregate amortization expense for the remainder of 2011 and each of the five
succeeding fiscal years and thereafter is as follows:
| |
|
|
|
|
| |
|
Estimated |
| Year |
|
Amortization Expense |
Six months ending December 31, 2011 |
|
$ |
3,246 |
|
2012 |
|
|
5,706 |
|
2013 |
|
|
3,331 |
|
2014 |
|
|
3,072 |
|
2015 |
|
|
2,687 |
|
2016 |
|
|
2,127 |
|
Thereafter |
|
|
12,635 |
|
16
5. Mortgage Notes Payable and Line of Credit
The Company’s mortgage notes payable and line of credit as of June 30, 2011 and December 31, 2010
are summarized below:
| |
|
|
|
|
|
|
|
|
|
|
|
|
|
|
|
|
|
|
|
|
| |
|
Date of |
|
|
|
|
|
|
|
|
|
|
|
|
|
| |
|
Issuance/ |
|
|
Principal |
|
|
Stated Interest Rate at |
|
Principal Balance Outstanding |
|
| |
|
Assumption |
|
|
Maturity Date |
|
|
June 30, 2011 (1) |
|
June 30, 2011 |
|
|
December 31, 2010 |
|
Fixed-Rate Mortgage Notes Payable: |
|
|
|
|
|
|
|
|
|
|
|
|
|
|
|
|
|
|
|
|
|
|
|
09/15/08 |
|
|
|
10/01/11 |
(2) |
|
|
4.58 |
% |
|
$ |
45,233 |
|
|
$ |
48,015 |
|
|
|
|
02/21/06 |
|
|
|
12/01/13 |
|
|
|
5.91 |
% |
|
|
8,934 |
|
|
|
9,022 |
|
|
|
|
02/21/06 |
|
|
|
06/30/14 |
|
|
|
5.20 |
% |
|
|
18,544 |
|
|
|
18,740 |
|
|
|
|
08/25/05 |
|
|
|
09/01/15 |
|
|
|
5.33 |
% |
|
|
20,602 |
|
|
|
20,771 |
|
|
|
|
09/12/05 |
|
|
|
09/01/15 |
|
|
|
5.21 |
% |
|
|
12,115 |
|
|
|
12,209 |
|
|
|
|
12/21/05 |
|
|
|
12/08/15 |
|
|
|
5.71 |
% |
|
|
18,589 |
|
|
|
18,728 |
|
|
|
|
09/06/07 |
|
|
|
12/11/15 |
|
|
|
5.81 |
% |
|
|
4,255 |
|
|
|
4,292 |
|
|
|
|
03/29/06 |
|
|
|
04/01/16 |
|
|
|
5.92 |
% |
|
|
16,968 |
|
|
|
17,000 |
|
|
|
|
04/27/06 |
|
|
|
05/05/16 |
|
|
|
6.58 |
% |
|
|
13,566 |
|
|
|
13,720 |
|
|
|
|
08/29/08 |
|
|
|
06/01/16 |
|
|
|
6.80 |
% |
|
|
6,092 |
|
|
|
6,162 |
|
|
|
|
06/20/11 |
|
|
|
06/30/16 |
|
|
|
6.08 |
% |
|
|
11,584 |
|
|
|
— |
|
|
|
|
11/22/06 |
|
|
|
12/01/16 |
|
|
|
5.76 |
% |
|
|
13,858 |
|
|
|
13,954 |
|
|
|
|
12/22/06 |
|
|
|
01/01/17 |
|
|
|
5.79 |
% |
|
|
21,184 |
|
|
|
21,330 |
|
|
|
|
02/08/07 |
|
|
|
03/01/17 |
|
|
|
6.00 |
% |
|
|
13,775 |
|
|
|
13,775 |
|
|
|
|
06/05/07 |
|
|
|
06/08/17 |
|
|
|
6.11 |
% |
|
|
14,240 |
|
|
|
14,240 |
|
|
|
|
10/15/07 |
|
|
|
11/08/17 |
|
|
|
6.63 |
% |
|
|
15,376 |
|
|
|
15,474 |
|
|
|
|
12/15/10 |
|
|
|
12/10/26 |
|
|
|
6.63 |
% |
|
|
10,602 |
|
|
|
10,795 |
|
|
|
|
03/16/05 |
|
|
|
04/01/30 |
|
|
|
6.33 |
% |
|
|
2,483 |
|
|
|
2,642 |
|
|
|
|
|
|
|
|
|
|
|
|
|
|
|
|
|
|
|
|
Contractual Fixed-Rate Mortgage Notes Payable: |
|
|
|
|
|
|
|
|
|
|
|
|
|
$ |
268,000 |
|
|
$ |
260,869 |
|
|
|
|
|
|
|
|
|
|
|
|
|
|
|
|
|
|
|
|
|
|
|
|
|
|
|
|
|
|
|
|
|
|
|
|
|
|
|
|
|
Premiums and Discounts, net: |
|
|
|
|
|
|
|
|
|
|
|
|
|
|
(876 |
) |
|
|
(1,274 |
) |
|
|
|
|
|
|
|
|
|
|
|
|
|
|
|
|
|
|
|
|
|
|
|
|
|
|
|
|
|
|
|
|
|
|
|
|
|
|
|
|
Total Fixed-Rate Mortgage Notes Payable: |
|
|
|
|
|
|
|
|
|
|
|
|
|
$ |
267,124 |
|
|
$ |
259,595 |
|
|
|
|
|
|
|
|
|
|
|
|
|
|
|
|
|
|
|
|
|
|
|
|
|
|
|
|
|
|
|
|
|
|
|
|
|
|
|
|
|
Variable-Rate Line of Credit: |
|
|
12/28/10 |
|
|
|
12/27/13 |
|
|
LIBOR +3.00% |
|
$ |
8,200 |
|
|
$ |
27,000 |
|
|
|
|
|
|
|
|
|
|
|
|
|
|
|
|
|
|
|
|
|
|
|
|
|
|
|
|
|
|
|
|
|
|
|
|
|
|
|
|
|
Total Mortgage Notes Payable and Line of Credit |
|
|
|
|
|
|
|
|
|
|
|
|
|
$ |
275,324 |
|
|
$ |
286,595 |
|
|
|
|
|
|
|
|
|
|
|
|
|
|
|
|
|
|
|
|
|
|
|
| (1) |
|
The weighted average interest rate on all debt outstanding at June 30, 2011 was approximately 5.60%. |
| |
| (2) |
|
This note has three annual extension options, which gives the Company the ability to extend the term of the note until October 1, 2013. The first of these options was exercised on September 30, 2010. |
Mortgage Notes Payable
As of June 30, 2011, the Company had 18 fixed-rate mortgage notes payable, collateralized by a
total of 56 properties. The Company is not a co-borrower, but has limited recourse liabilities that
could result from any one or more of the following circumstances: a borrower voluntarily filing for
bankruptcy, improper conveyance of a property, fraud or material misrepresentation, misapplication
or misappropriation of rents, security deposits, insurance proceeds or condemnation proceeds, or
physical waste or damage to the property resulting from a borrower’s gross negligence or willful
misconduct. The Company will also indemnify lenders against claims resulting from the presence of
hazardous substances or activity involving hazardous substances in violation of environmental laws
on a property. The weighted-average interest rate on the mortgage notes payable as of June 30,
2011 was 5.68%.
The Company has $45,233 of balloon principal payments maturing under one of its long-term mortgages
on September 30, 2011; however, the mortgage has two remaining annual extension options through
2013, and the Company intends to exercise one of these options in 2011. As long as the Company is
in compliance with certain covenants under the mortgage loan, it will be able to exercise the
renewal option. As of June 30, 2011 the Company was in compliance with these covenants.
17
The fair market value of all fixed-rate mortgage notes payable outstanding as of June 30, 2011 was
$261,089, as compared to the carrying value stated above of $267,124. The fair market value is
calculated based on a discounted cash flow analysis, using interest rates based on management’s
estimate of market interest rates on long-term debt with comparable terms.
Scheduled principal payments of mortgage notes payable for the remainder of 2011, each of the five
succeeding fiscal years and thereafter are as follows:
| |
|
|
|
|
|
| |
|
|
Scheduled principal |
|
| Year |
|
|
payments |
|
Six months ending December 31, 2011 |
|
|
$ |
47,081 |
(1) |
2012 |
|
|
|
3,956 |
|
2013 |
|
|
|
12,793 |
|
2014 |
|
|
|
21,439 |
|
2015 |
|
|
|
55,282 |
|
2016 |
|
|
|
58,850 |
|
Thereafter |
|
|
|
68,599 |
|
|
|
|
|
|
|
|
|
$ |
268,000 |
|
|
|
|
|
|
|
|
|
| (1) |
|
The $45.2 million mortgage note issued in September 2008 was
extended on September 30, 2010 for one year. The Company expects to exercise
additional options to extend the maturity date until October 2013. |
Line of Credit
In December 2010, the Company procured a $50,000 line of credit (with Capital One, N.A. serving as
a revolving lender, a letter of credit issuer and as an administrative agent and Branch Banking and
Trust Company serving as a revolving lender and a letter of credit issuer), which matures on
December 28, 2013. The line of credit provides for a senior secured revolving credit facility of
up to $50,000 with a standby letter of credit sublimit of up to $20,000. The line of credit may,
upon satisfaction of certain conditions, be expanded up to $75,000. Currently, nine of the
Company’s properties are pledged as collateral under its line of credit. The interest rate per
annum applicable to the line of credit is equal to the London Interbank Offered Rate, or LIBOR,
plus an applicable margin of up to 3.00%, depending upon the Company’s leverage. The leverage ratio
used in determining the applicable margin for interest on the line of credit is recalculated
quarterly. The Company is subject to an annual maintenance fee of 0.25% per year. The Company’s
ability to access this source of financing is subject to its continued ability to meet customary
lending requirements, such as compliance with financial and operating covenants and its meeting
certain lending limits. One such covenant requires the Company to limit distributions to its
stockholders to 95% of our FFO, with acquisition-related costs required to be expensed under ASC
805 added back to FFO. In addition, the maximum amount the Company may draw under this agreement is
based on a percentage of the value of properties pledged as collateral to the banks, which must
meet agreed upon eligibility standards.
If and when long-term mortgages are arranged for these pledged properties, the banks will release
the properties from the line of credit and reduce the availability under the line of credit by the
advanced amount of the released property. Conversely, as the Company purchases new properties
meeting the eligibility standards, it may pledge these new properties to obtain additional
availability under this agreement. The availability under the line of credit will also be reduced
by letters of credit used in the ordinary course of business. The Company may use the advances
under the line of credit for both general corporate purposes and the acquisition of new
investments.
18
At June 30, 2011, there was $8,200 outstanding under the line of credit at an interest rate of 3.2%
and $5,050 outstanding under letters of credit at a weighted average interest rate of 3.0%. At
June 30, 2011, the remaining borrowing capacity available under the line of credit was $32,314.
The Company was in compliance with all covenants under the line of credit as of June 30, 2011. The
amount outstanding on the line of credit as of June 30, 2011 approximates fair value, because the
debt is short-term and variable rate.
6. Stockholders’ Equity
The following table summarizes the changes in stockholders’ equity for the six months ended June
30, 2011:
| |
|
|
|
|
|
|
|
|
|
|
|
|
|
|
|
|
|
|
|
|
|
|
|
|
|
|
|
|
| |
|
|
|
|
|
|
|
|
|
|
|
|
|
|
|
|
|
|
|
|
|
Distributions in |
|
|
|
|
| |
|
|
|
|
|
|
|
|
|
|
|
|
|
Capital in |
|
|
Notes |
|
|
Excess of |
|
|
Total |
|
| |
|
Preferred |
|
|
Senior Common |
|
|
Common |
|
|
Excess of |
|
|
Receivable |
|
|
Accumulated |
|
|
Stockholders’ |
|
| |
|
Stock |
|
|
Stock |
|
|
Stock |
|
|
Par Value |
|
|
from Employees |
|
|
Earnings |
|
|
Equity |
|
Balance at December 31, 2010 |
|
$ |
2 |
|
|
$ |
— |
|
|
$ |
9 |
|
|
$ |
174,261 |
|
|
$ |
(963 |
) |
|
$ |
(61,934 |
) |
|
$ |
111,375 |
|
|
|
|
|
|
|
|
|
|
|
|
|
|
|
|
|
|
|
|
|
|
|
|
|
|
|
|
|
|
|
|
|
|
|
|
|
|
|
|
|
|
|
|
|
|
|
|
|
|
|
|
Issuance of common stock, net |
|
|
— |
|
|
|
— |
|
|
|
2 |
|
|
|
34,403 |
|
|
|
— |
|
|
|
— |
|
|
|
34,405 |
|
|
|
|
|
|
|
|
|
|
|
|
|
|
|
|
|
|
|
|
|
|
|
|
|
|
|
|
|
|
Repayment of principal on employee notes receivable |
|
|
— |
|
|
|
— |
|
|
|
— |
|
|
|
— |
|
|
|
532 |
|
|
|
— |
|
|
|
532 |
|
|
|
|
|
|
|
|
|
|
|
|
|
|
|
|
|
|
|
|
|
|
|
|
|
|
|
|
|
|
Distributions declared to common, senior common and preferred stockholders |
|
|
— |
|
|
|
— |
|
|
|
— |
|
|
|
— |
|
|
|
— |
|
|
|
(9,302 |
) |
|
|
(9,302 |
) |
|
|
|
|
|
|
|
|
|
|
|
|
|
|
|
|
|
|
|
|
|
|
|
|
|
|
|
|
|
Net income |
|
|
— |
|
|
|
— |
|
|
|
— |
|
|
|
— |
|
|
|
— |
|
|
|
2,850 |
|
|
|
2,850 |
|
|
|
|
|
|
|
|
|
|
|
|
|
|
|
|
|
|
|
|
|
|
|
|
|
|
|
|
|
|
|
|
|
|
|
|
|
|
|
|
|
|
|
|
|
|
|
|
|
|
|
|
Balance at June 30, 2011 |
|
$ |
2 |
|
|
$ |
— |
|
|
$ |
11 |
|
|
$ |
208,664 |
|
|
$ |
(431 |
) |
|
$ |
(68,386 |
) |
|
$ |
139,860 |
|
|
|
|
|
|
|
|
|
|
|
|
|
|
|
|
|
|
|
|
|
|
|
The following table is a summary of all outstanding notes issued to employees of the Adviser for
the exercise of stock options:
| |
|
|
|
|
|
|
|
|
|
|
|
|
|
|
|
|
|
|
|
|
|
|
|
|
|
|
|
|
| |
|
Number of |
|
|
Strike Price |
|
|
Amount of |
|
|
Outstanding Balance |
|
|
Outstanding Balance |
|
|
|
|
|
|
|
| |
|
Options |
|
|
of Options |
|
|
Promissory Note |
|
|
of Employee Loans at |
|
|
of Employee Loans at |
|
|
Maturity Date |
|
|
Interest Rate |
|
| Date Issued |
|
Exercised |
|
|
Exercised |
|
|
Issued to Employees |
|
|
June 30, 2011 |
|
|
December 31, 2010 |
|
|
of Note |
|
|
on Note |
|
Sep 2004 |
|
|
25 |
|
|
$ |
15.00 |
|
|
$ |
375 |
|
|
$ |
20 |
|
|
$ |
20 |
|
|
Sep 2013 |
|
|
5.00 |
% |
Apr 2006 |
|
|
12 |
|
|
|
16.10 |
|
|
|
193 |
|
|
|
4 |
|
|
|
5 |
|
|
Apr 2015 |
|
|
7.77 |
% |
May 2006 |
|
|
50 |
|
|
|
16.85 |
|
|
|
843 |
|
|
|
— |
|
|
|
531 |
|
|
May 2016 |
|
|
7.87 |
% |
May 2006 |
|
|
2 |
|
|
|
16.10 |
|
|
|
32 |
|
|
|
32 |
|
|
|
32 |
|
|
May 2016 |
|
|
7.87 |
% |
Nov 2006 |
|
|
25 |
|
|
|
15.00 |
|
|
|
375 |
|
|
|
375 |
|
|
|
375 |
|
|
Nov 2015 |
|
|
8.15 |
% |
|
|
|
|
|
|
|
|
|
|
|
|
|
|
|
|
|
|
|
|
|
|
|
|
|
| |
|
|
|
114 |
|
|
|
|
|
|
$ |
1,818 |
|
|
$ |
431 |
|
|
$ |
963 |
|
|
|
|
|
|
|
|
|
|
|
|
|
|
|
|
|
|
|
|
|
|
|
|
|
|
|
|
|
|
|
|
|
|
In accordance with ASC 505-10-45-2, “Equity,” receivables from employees for the issuance of
capital stock to employees prior to the receipt of cash payment should be reflected in the balance
sheet as a reduction to stockholders’ equity. Therefore, these notes were recorded as full recourse
loans to employees and are included in the equity section of the accompanying consolidated balance
sheets. As of June 30, 2011, each loan maintained its full recourse status.
19
The Company’s Board of Directors declared the following distributions per share for the three and
six months ended June 30, 2011 and 2010:
| |
|
|
|
|
|
|
|
|
|
|
|
|
|
|
|
|
| |
|
For the three months ended June 30, |
|
For the six months ended June 30, |
| |
|
2011 |
|
2010 |
|
2011 |
|
2010 |
Common Stock |
|
$ |
0.375 |
|
|
$ |
0.375 |
|
|
$ |
0.750 |
|
|
$ |
0.750 |
|
Senior Common Stock |
|
$ |
0.2625 |
|
|
$ |
0.2625 |
|
|
$ |
0.5250 |
|
|
$ |
0.5250 |
|
Series A Preferred Stock |
|
$ |
0.4843749 |
|
|
$ |
0.4843749 |
|
|
$ |
0.9687498 |
|
|
$ |
0.9687498 |
|
Series B Preferred Stock |
|
$ |
0.4688 |
|
|
$ |
0.4688 |
|
|
$ |
0.9375 |
|
|
$ |
0.9375 |
|
On February 2, 2011, the Company sold 725,000 shares of its common stock at $18.35 per share in an
underwritten public offering of its common stock. The Company also granted the underwriters a
30-day option to purchase up to 108,750 shares of common stock on the same terms and conditions to
cover over-allotments, if any. On February 11, 2011, the underwriters exercised their option to
purchase an additional 108,750 shares of common stock. The net proceeds, including the
over-allotment, after deducting the underwriting discount and offering expenses were $14,322. The
Company used the proceeds of the offering to repay a portion of the outstanding balance under its
line of credit and for general corporate purposes.
On June 15, 2011, the Company sold 1,200,000 shares of its common stock at $17.55 per share in an
underwritten public offering of its common stock. The Company also granted the underwriters a
30-day option to purchase up to 180,000 shares of common stock on the same terms and conditions to
cover over- allotments, if any. On July 6, 2011, the underwriters exercised their option to
purchase an additional 174,000 shares of common stock. The net proceeds, including the
over-allotment, after deducting the underwriting discount and offering expenses were $22,705. The
Company used the proceeds of the offering to repay a portion of the outstanding balance under its
line of credit and for general corporate purposes.
The Company has an open market sale agreement, or the Open Market Sale Agreement, with Jefferies &
Company, Inc., or Jefferies, under which it may, from time to time, offer to sell shares of its
common stock with an aggregate sales price of up to $25,000 on the open market through Jefferies,
as agent, or to Jefferies, as principal. As of June 30, 2011, the Company had sold 192,365 shares
with net proceeds of $3,400, and has a remaining capacity to sell up to $21,600 of common stock
under the Open Market Sale Agreement with Jefferies. The program was not utilized during the three
months ending June 30, 2011.
On March 28, 2011, the Company commenced an offering of an aggregate of 3,500,000 shares of its
senior common stock, par value $0.001 per share, at a price to the public of $15.00 per share, of
which 3,000,000 shares are intended to be offered pursuant to the primary offering and 500,000
shares are intended to be offered pursuant to the Company’s distribution reinvestment plan (the
“DRIP”). The Company, however, reserves the right to reallocate the number of shares being offered
between the primary offering and the DRIP. To date the Company has not sold any shares of senior
common stock in this ongoing offering.
7. Subsequent Events
On July 6, 2011, in connection with the Company’s common stock offering completed on June 15, 2011,
the underwriters of the offering exercised and closed their option to purchase an additional
174,000 shares
of common stock from the Company. The Company received approximately $2,865 in additional net
proceeds from the sale of these shares after deducting the underwriting discount and offering
expenses.
20
On July 12, 2011, the Company’s Board of Directors declared the following monthly distributions:
| |
|
|
|
|
|
|
| Common Stock Cash Distributions |
| |
|
|
|
Distribution |
| Record Date |
|
Payment Date |
|
per Share |
July 22, 2011 |
|
July 29, 2011 |
|
$ |
0.125 |
|
August 19, 2011 |
|
August 31, 2011 |
|
$ |
0.125 |
|
September 22, 2011 |
|
September 30, 2011 |
|
$ |
0.125 |
|
| |
|
|
|
|
|
|
| Senior Common Stock Cash Distributions |
| Payable to the Holders or |
|
|
|
Distribution |
| Record During the Month of: |
|
Payment Date |
|
per Share |
July |
|
August 5, 2011 |
|
$ |
0.0875 |
|
August |
|
September 8, 2011 |
|
$ |
0.0875 |
|
September |
|
October 7, 2011 |
|
$ |
0.0875 |
|
| |
|
|
|
|
|
|
| Series A Preferred Stock Cash Distibutions |
| |
|
|
|
Distribution |
| Record Date |
|
Payment Date |
|
per Share |
July 22, 2011 |
|
July 29, 2011 |
|
$ |
0.1614583 |
|
August 19, 2011 |
|
August 31, 2011 |
|
$ |
0.1614583 |
|
September 22, 2011 |
|
September 30, 2011 |
|
$ |
0.1614583 |
|
| |
|
|
|
|
|
|
| Series B Preferred Stock Cash Distibutions |
| |
|
|
|
Distribution |
| Record Date |
|
Payment Date |
|
per Share |
July 22, 2011 |
|
July 29, 2011 |
|
$ |
0.15625 |
|
August 19, 2011 |
|
August 31, 2011 |
|
$ |
0.15625 |
|
September 22, 2011 |
|
September 30, 2011 |
|
$ |
0.15625 |
|
21
Item 2. Management’s Discussion and Analysis of Financial Condition and Results of Operations
All statements contained herein, other than historical facts, may constitute “forward-looking
statements” within the meaning of Section 27A of the Securities Act of 1933, as amended, and
Section 21E of the Securities Exchange Act of 1934, as amended, or the Exchange Act. These
statements may relate to, among other things, future events or our future performance or financial
condition. In some cases, you can identify forward-looking statements by terminology such as “may,”
“might,” “believe,” “will,” “provided,” “anticipate,” “future,” “could,” “growth,” “plan,”
“intend,” “expect,” “should,” “would,” “if,” “seek,” “possible,” “potential,” “likely” or the
negative of such terms or comparable terminology. These forward-looking statements involve known
and unknown risks, uncertainties and other factors that may cause our business, financial
condition, liquidity, results of operations, funds from operations or prospects to be materially
different from any future business, financial condition, liquidity, results of operations, funds
from operations or prospects expressed or implied by such forward-looking statements.
For further information about these and other factors that could affect our future results, please see the
captions titled “Risk Factors” in this report and in our Annual Report on Form 10-K for the year ended December 31, 2010.
We caution readers not to place undue reliance on any such forward-looking statements, which are made pursuant
to the Private Securities Litigation Reform Act of 1995 and, as such, speak only as of the date
made. We undertake no obligation to publicly update or revise any forward-looking statements,
whether as a result of new information, future events or otherwise, after the date of this
Quarterly Report on Form 10-Q, or Report.
All references to “we,” “our,” “us” and the “Company” in this Report mean Gladstone Commercial
Corporation and its consolidated subsidiaries, except where it is made clear that the term means
only Gladstone Commercial Corporation.
OVERVIEW
General
We were incorporated under the General Corporation Law of the State of Maryland on February 14,
2003, primarily for the purpose of investing in and owning net leased industrial and commercial
real property and selectively making long-term industrial and commercial mortgage loans. Most of
our portfolio of real estate is leased to a wide cross section of tenants ranging from small
businesses to large public companies, many of which are corporations that do not have
publicly-rated debt. We have historically entered into, and intend in the future to enter into,
purchase agreements for real estate having triple net leases with terms of approximately 10 to 15
years and built in rental rate increases. Under a triple net lease, the tenant is required to pay
all operating, maintenance and insurance costs and real estate taxes with respect to the leased
property. We are actively communicating with buyout funds, real estate brokers and other third
parties to locate properties for potential acquisition or to provide mortgage financing in an
effort to build our portfolio. We currently own 67 properties totaling 6.9 million square feet,
which have a total gross and net carrying value, including intangible assets, of $473.2 million and
$404.0 million, respectively.
Business Environment
The United States continues to recover from the recession that it entered into during late 2007;
however, unemployment remains high and housing starts are low, and these key economic indicators
will need to improve for the economy to fully recover. As a result, conditions within the U.S.
capital markets generally, and the U.S. real estate capital markets particularly, continue to
experience significant dislocation and stress. While we are seeing signs of improvement in both
the equity and debt capital markets, these markets remain somewhat challenging.
As a result, the continued challenging economic conditions could still materially and adversely
impact the financial condition of one or more of our tenants and, therefore, could increase the
likelihood that a tenant may declare bankruptcy or default upon its payment obligations arising
under a related lease. For example, the tenant occupying our building located in Hazelwood,
Missouri declared bankruptcy in October 2010. The tenant did not confirm our lease in its
bankruptcy proceedings in March 2011, and the final rent
22
payment was received in April 2011. We are currently working to re-tenant this property. In
addition, one of our other buildings remains vacant. The leases on these two vacant buildings
comprised 2.4% of our annualized rental income and the annual carrying costs are $223,000. We are
actively seeking new tenants for these properties. All of our remaining properties are occupied
and the tenants are paying in accordance with their leases.
Moreover, our ability to make new investments is highly dependent upon our ability to procure
external financing. Our principal sources of external financing generally include the issuance of
equity securities, long-term mortgage loans secured by properties and borrowings under our line of
credit. The market for long-term mortgages has been limited for some time; however, we have
recently seen mid-to-long-term (5 to 10 year) mortgages become more obtainable. The collateralized
mortgage backed securities, or CMBS, market has been making a comeback in recent months, but it is
much more conservative than it was prior to the recession. As a result, we will likely not have the
same level of access to the CMBS market that we had prior to the recession. Consequently, we will
be looking to both regional banks and the CMBS market to issue mortgages to finance our real estate
activities.
Recent Developments
Investment Activities
On April 4, 2011, we acquired a 60,000 square foot office building located in Hickory, North
Carolina for $10.7 million, including related acquisition expenses of $59,000. We funded this
acquisition using borrowings from our line of credit. At closing, we were assigned the existing
triple net lease with the existing tenant, which has a remaining term of approximately nine years.
The tenant has two options to extend the lease for additional periods of five years each. The
lease provides for prescribed rent escalations over the life of the lease, with annualized straight
line rents of $1.1 million.
On June 20, 2011, we acquired a 78,421 square foot office building located in Springfield, Missouri
for $15.9 million, including related acquisition expenses of $57,000. We funded this acquisition
through a combination of borrowings from our line of credit and the assumption of approximately
$11.6 million of mortgage debt on the property. At closing, we were assigned the existing triple
net lease with T-Mobile USA, Inc., which has a remaining term of approximately ten years. The
tenant has three options to extend the lease for additional periods of five years each. The lease
provides for prescribed rent escalations over the life of the lease, with annualized straight line
rents of $1.4 million.
Leasing Activities
On May 15, 2011, we re-leased our previously vacant building located in South Hadley, Massachusetts
for a period of six months, with a three-month extension option. The lease provides for rent over
the term of $101,000.
On June 23, 2011, we extended the lease with the tenant occupying our properties located in Angola,
Indiana and Rock Falls, Illinois. The lease covering these properties was extended for an
additional three year period, thereby extending the lease until August 2023. The lease was
originally set to expire in August 2020. The lease provides for prescribed rent escalations over
the life of the lease, with annualized straight line rents of approximately $345,000. Furthermore,
the lease grants the tenant three options to extend the lease for a period of five years each.
Equity Activities
On February 2, 2011, we closed on the sale of 725,000 shares of our common stock at $18.35 per
share in an underwritten public offering of our common stock. Subsequently, on February 16, 2011,
we closed on the sale of an additional 108,750 shares of common stock on the same terms and
conditions in connection with the underwriters’ exercise of their over-allotment option. The net
proceeds, including the over-allotment, after deducting the underwriting discount and offering
expenses were $14.3 million. We used
23
the proceeds of the offering to repay a portion of the outstanding balance under our line of credit
and for general corporate purposes. The shares were issued under our effective shelf registration
statement on file with the Securities and Exchange Commission, or SEC.
On June 15, 2011, we closed on the sale of 1,200,000 shares of our common stock at $17.55 per share
in an underwritten public offering of our common stock. Subsequently, on July 6, 2011, we closed on
the sale of an additional 174,000 shares of common stock on the same terms and conditions in
connection with the underwriters’ exercise of their over-allotment option. The net proceeds,
including the over-allotment, after deducting the underwriting discount and offering expenses were
$22.7 million. We used the proceeds of the offering to repay a portion of the outstanding balance
under our line of credit and for general corporate purposes. The shares were issued under our
effective shelf registration statement on file with the SEC.
Diversity of Our Portfolio
Gladstone Management Corporation, or our Adviser, seeks to diversify our portfolio to avoid
dependence on any one particular tenant, geographic market or tenant industry. By diversifying our
portfolio, our Adviser intends to reduce the adverse effect on our portfolio of a single
under-performing investment or a downturn in any particular industry or geographic market. Our
largest tenant at June 30, 2011 comprised 7.2% of our total rental income, and our largest
concentration of properties was located in Ohio, which accounted for 17.4% of our total rental
income. The table below reflects the breakdown of our total rental income by tenant industry
classification for the six months ended June 30, 2011 and 2010, respectively:
| |
|
|
|
|
|
|
|
|
|
|
|
|
|
|
|
|
| |
|
For the six months ended June 30, 2011 |
|
|
For the six months ended June 30, 2010 |
|
| |
|
(Dollars in Thousands) |
|
|
(Dollars in Thousands) |
|
| |
|
|
|
|
|
Percentage of |
|
|
|
|
|
|
Percentage of |
|
| Industry Classification |
|
Rental Income |
|
|
Rental Income |
|
|
Rental Income |
|
|
Rental Income |
|
Healthcare, Education &
Childcare |
|
$ |
3,175 |
|
|
|
15.2 |
% |
|
$ |
3,073 |
|
|
|
14.8 |
% |
Electronics |
|
|
3,083 |
|
|
|
14.8 |
|
|
|
3,083 |
|
|
|
14.8 |
|
Telecommunications |
|
|
2,767 |
|
|
|
13.3 |
|
|
|
2,724 |
|
|
|
13.1 |
|
Diversified/Conglomerate
Manufacturing |
|
|
1,833 |
|
|
|
8.8 |
|
|
|
1,832 |
|
|
|
8.8 |
|
Chemicals, Plastics & Rubber |
|
|
1,569 |
|
|
|
7.5 |
|
|
|
1,565 |
|
|
|
7.5 |
|
Containers, Packaging & Glass |
|
|
1,166 |
|
|
|
5.6 |
|
|
|
1,165 |
|
|
|
5.6 |
|
Machinery |
|
|
1,126 |
|
|
|
5.4 |
|
|
|
1,194 |
|
|
|
5.7 |
|
Beverage, Food & Tobacco |
|
|
1,094 |
|
|
|
5.3 |
|
|
|
1,094 |
|
|
|
5.3 |
|
Printing & Publishing |
|
|
1,033 |
|
|
|
5.0 |
|
|
|
1,096 |
|
|
|
5.3 |
|
Personal & Non-Durable
Consumer Products |
|
|
1,116 |
|
|
|
5.4 |
|
|
|
677 |
|
|
|
3.3 |
|
Buildings and Real Estate |
|
|
1,052 |
|
|
|
5.1 |
|
|
|
1,023 |
|
|
|
4.9 |
|
Oil & Gas |
|
|
635 |
|
|
|
3.0 |
|
|
|
647 |
|
|
|
3.1 |
|
Automobile |
|
|
583 |
|
|
|
2.8 |
|
|
|
583 |
|
|
|
2.8 |
|
Personal, Food &
Miscellaneous Services |
|
|
288 |
|
|
|
1.4 |
|
|
|
288 |
|
|
|
1.4 |
|
Home & Office Furnishings |
|
|
265 |
|
|
|
1.3 |
|
|
|
265 |
|
|
|
1.3 |
|
Diversified/Conglomerate
Services |
|
|
379 |
|
|
|
1.8 |
|
|
|
154 |
|
|
|
0.7 |
|
Insurance |
|
|
— |
|
|
|
0.0 |
|
|
|
361 |
|
|
|
1.7 |
|
|
|
|
|
|
|
|
|
|
|
|
|
|
|
|
$ |
21,164 |
|
|
|
100.0 |
% |
|
$ |
20,824 |
|
|
|
100.0 |
% |
|
|
|
|
|
|
|
|
|
|
|
|
|
24
Our Adviser and Administrator
Our Adviser is led by a management team which has extensive experience purchasing real estate and
originating mortgage loans. Our Adviser is controlled by Mr. David Gladstone, our chairman and
chief executive officer. Mr. Gladstone is also the chairman and chief executive officer of our
Adviser. Terry Lee Brubaker, our vice chairman, chief operating officer, secretary and director, is
a member of the board of directors of our Adviser as well as its vice chairman and chief operating
officer. George Stelljes III, our president, chief investment officer and director, is a member of
the board of directors of our Adviser and its president and chief investment officer. Gladstone
Administration, LLC, or our Administrator, employs our chief financial officer, chief compliance
officer, internal counsel, treasurer, investor relations department and their respective staffs.
Our Adviser and Administrator also provide investment advisory and administrative services,
respectively, to our affiliates, Gladstone Capital Corporation and Gladstone Investment
Corporation, both publicly-traded business development companies, as well as Gladstone Land
Corporation, a private agricultural real estate company. With the exception of our chief financial
officer, all of our executive officers serve as either directors or executive officers, or both, of
Gladstone Capital Corporation and Gladstone Investment Corporation. Our treasurer is also an
executive officer of Gladstone Securities, a broker-dealer registered with the Financial Industry
Regulatory Authority. In the future, our Adviser may provide investment advisory services to other
funds, both public and private, of which it is the sponsor.
Advisory and Administration Agreements
We are externally managed pursuant to contractual arrangements with our Adviser and our
Administrator. Our Adviser and Administrator employ all of our personnel and pay their payroll,
benefits, and general expenses directly. We have an advisory agreement with our Adviser, or the
Advisory Agreement, and an administration agreement with our Administrator, or the Administration
Agreement.
Under the terms of the Advisory Agreement, we are responsible for all expenses incurred for our
direct benefit. Examples of these expenses include legal, accounting, interest on short-term debt
and mortgages, tax preparation, directors’ and officers’ insurance, stock transfer services,
stockholder-related fees, consulting and related fees. In addition, we are also responsible for
all fees charged by third parties that are directly related to our business, which may include real
estate brokerage fees, mortgage placement fees, lease-up fees and transaction structuring fees
(although we may be able to pass some or all of such fees on to our tenants and borrowers).
During the three and six months ended June 30, 2011 and 2010, none of these third party expenses
were incurred by us directly. The actual amount of such fees that we incur in the future will
depend largely upon the aggregate costs of the properties that we acquire, the aggregate amount of
mortgage loans that we make and the extent to which we are able to shift the burden of such fees to
our tenants and borrowers. Accordingly, the amount of these fees that we will pay in the future is
not determinable at this time.
Management Services and Fees under the Advisory Agreement
The Advisory Agreement provides for an annual base management fee equal to 2.0% of our total
stockholders’ equity, less the recorded value of any preferred stock, or total common stockholders’
equity, and for an incentive fee based on funds from operations, or FFO. Our Adviser does not
charge acquisition or disposition fees when we acquire or dispose of properties as is common with
other externally-advised REITs. Furthermore, there are no fees charged when our Adviser secures
long or short term credit or arranges mortgage loans on our properties, however, our Adviser may
earn fee income from our borrowers or tenants or other sources. This fee income earned by our
Adviser, or a portion thereof, may, at the sole discretion of the Board of Directors, be credited
against our base management fee as a rebate to the base management fee.
25
For purposes of calculating the incentive fee, FFO includes any realized capital gains and capital
losses, less any distributions paid on preferred stock and senior common stock, but FFO does not
include any unrealized capital gains or losses. The incentive fee would reward our Adviser if our
quarterly FFO, before giving effect to any incentive fee, or pre-incentive fee FFO, exceeds 1.75%,
or the hurdle rate, of total common stockholders’ equity. We pay our Adviser an incentive fee with
respect to our pre-incentive fee FFO in each calendar quarter as follows:
| |
• |
|
no incentive fee in any calendar quarter in which our pre-incentive fee FFO does not
exceed the hurdle rate of 1.75% (7% annualized); |
| |
| |
• |
|
100% of the amount of the pre-incentive fee FFO that exceeds the hurdle rate, but is
less than 2.1875% in any calendar quarter (8.75% annualized); and |
| |
| |
• |
|
20% of the amount of our pre-incentive fee FFO that exceeds 2.1875% in any calendar
quarter (8.75% annualized). |
Quarterly Incentive Fee Based on FFO
Pre-incentive fee FFO
(expressed as a percentage of total common stockholders’ equity)
Percentage of pre-incentive fee FFO allocated to the incentive fee
The incentive fee may be reduced because of a covenant which exists in our line of credit agreement
which limits distributions to our stockholders to 95% of FFO. In order to comply with this
covenant, our Board of Directors accepted our Adviser’s offer to unconditionally, irrevocably and
voluntarily waive on a quarterly basis a portion of the incentive fee for both the three and six
months ended June 30, 2011 and 2010, respectively, which allowed us to maintain the current level
of distributions to our stockholders. These waived fees may not be recouped by our Adviser in the
future. Our Adviser has indicated that it intends to continue to waive all or a portion of the
incentive fee in order to support the current level of distributions to our stockholders; however,
our Adviser is not required to issue any such waiver, either in whole or in part.
Administration Agreement
Pursuant to the Administration Agreement, we pay for our allocable portion of our Administrator’s
overhead expenses incurred while performing its obligations to us, including, but not limited to,
rent and the salaries and benefits expenses of our personnel, including our chief financial
officer, chief compliance officer, internal counsel, treasurer, investor relations and their
respective staffs. Our allocable portion of expenses is generally derived by multiplying our
Administrator’s total expenses by the percentage of our total assets at the beginning of each
quarter in comparison to the total assets of all companies managed by our Adviser under similar
agreements.
Critical Accounting Policies
The preparation of our financial statements in accordance with generally accepted accounting
principles in the United States of America, or GAAP, requires management to make judgments that are
subjective in nature in order to make certain estimates and assumptions. Management relies on its
experience, collects historical and current market data and analyzes this information in order to
arrive at what it believes to be reasonable estimates. Under different conditions or assumptions,
materially different amounts could be reported related to the accounting policies described below.
In addition, application of these accounting
26
policies involves the exercise of judgment regarding
the use of assumptions as to future uncertainties, and as a result, actual results could materially
differ from these estimates. A summary of all of our significant accounting policies is provided
in Note 1 to our consolidated financial statements included elsewhere in
this Form 10-Q. Below is a summary of accounting polices involving estimates and assumptions that
require complex, subjective or significant judgments in their application and that materially
affect our results of operations.
Allocation of Purchase Price
When we acquire real estate, we allocate the purchase price, less any expenses related to the
acquisition, to (i) the acquired tangible assets and liabilities, consisting of land, building,
tenant improvements, long-term debt and (ii) the identified intangible assets and liabilities,
consisting of the value of above-market and below-market leases, in-place leases, unamortized lease
origination costs, tenant relationships and capital lease obligations, based in each case on their
fair values. All expenses related to the acquisition are expensed as incurred, rather than
capitalized into the cost of the acquisition as had been required by the previous accounting.
Management’s estimates of value are made using methods similar to those used by independent
appraisers (e.g., discounted cash flow analysis). Factors considered by management in its analysis
include an estimate of carrying costs during hypothetical expected lease-up periods, considering
current market conditions and costs to execute similar leases. We also consider information
obtained about each property as a result of our pre-acquisition due diligence, marketing and
leasing activities in estimating the fair value of the tangible and intangible assets and
liabilities acquired. In estimating carrying costs, management also includes real estate taxes,
insurance and other operating expenses and estimates of lost rentals at market rates during the
hypothetical expected lease-up periods, which primarily range from 9 to 18 months, depending on
specific local market conditions. Management also estimates costs to execute similar leases,
including leasing commissions, legal and other related expenses to the extent that such costs are
not already incurred in connection with a new lease origination as part of the transaction.
Management also considers the nature and extent of our existing business relationships with the
tenant, growth prospects for developing new business with the tenant, the tenant’s credit quality
and management’s expectations of lease renewals (including those existing under the terms of the
lease agreement), among other factors. A change in any of the assumptions above, which are very
subjective, could have a material impact on our results of operations.
The allocation of the purchase price directly affects the following in our consolidated financial
statements:
| |
• |
|
The amount of purchase price allocated to the various tangible and intangible assets on
our balance sheet; |
| |
| |
• |
|
The amounts allocated to the value of above-market and below-market lease values are
amortized to rental income over the remaining non-cancelable terms of the respective
leases. The amounts allocated to all other tangible and intangible assets are amortized
to depreciation or amortization expense. Thus, depending on the amounts allocated between
land and other depreciable assets, changes in the purchase price allocation among our
assets could have a material impact on our FFO, a metric which is used by many REIT
investors to evaluate our operating performance; and |
| |
| |
• |
|
The period of time over which tangible and intangible assets are depreciated varies
greatly, and thus, changes in the amounts allocated to these assets will have a direct
impact on our results of operations. Intangible assets are generally amortized over the
respective life of the leases, which normally range from 10 to 15 years. Also, we
depreciate our buildings over 39 years, but do not depreciate our land. These differences
in timing could have a material impact on our results of operations. |
27
Asset Impairment Evaluation
We periodically review the carrying value of each property to determine if circumstances that
indicate impairment in the carrying value of the investment exist or that depreciation periods
should be modified. In determining if impairment exists, management considers such factors as our
tenants’ payment histories, the financial condition of our tenants, including calculating the
current leverage ratios of tenants, the likelihood of lease renewal, business conditions in the
industries in which our tenants operate and whether the carrying value of our real estate has
decreased. If any of the factors above support the possibility of impairment, we prepare a
projection of the undiscounted future cash flows, without interest charges, of the specific
property and determine if the carrying amount in such property is recoverable. In preparing the
projection of undiscounted future cash flows, we estimate the holding periods of the properties and
cap rates using information that we obtain from market comparability studies and other comparable
sources. If impairment is indicated, the carrying value of the property would be written down to
its estimated fair value based on our best estimate of the property’s discounted future cash flows
using assumptions from market participants. Any material changes to the estimates and assumptions
used in this analysis could have a significant impact on our results of operations, as the changes
would impact our determination of whether impairment is deemed to have occurred and the amount of
impairment loss that we would recognize.
Using the methodology discussed above and in light of the current economic conditions discussed
above in “Overview-Business Environment,” we evaluated our entire portfolio as of June 30, 2011 for
any impairment indicators and performed an impairment analysis on those select properties that had
an indication of impairment. As a result of this analysis, we concluded that none of our properties
were impaired and we will continue to monitor our portfolio for any indicators that may change our
conclusion.
28
Results of Operations
The weighted-average yield on our total portfolio, taking into account vacant properties, was 9.4%
as of June 30, 2011. If the portfolio were fully occupied the weighted-average yield would have
been 9.6%, assuming returns on our vacant buildings remain steady, as of June 30, 2011. The
weighted-average yield on our portfolio is calculated by taking the annualized straight-line rents,
reflected as rental income on our consolidated statements of operations, of each acquisition as a
percentage of the acquisition. The weighted-average yield does not account for the interest
expense incurred on the mortgages placed on our properties.
A
comparison of our operating results for the three and six months ended June 30, 2011 and 2010 is below:
| |
|
|
|
|
|
|
|
|
|
|
|
|
|
|
|
|
| |
|
For the three months ended June 30, |
|
| |
|
2011 |
|
|
2010 |
|
|
$ Change |
|
|
% Change |
|
| |
|
(Dollars in Thousands) |
|
Operating revenues |
|
|
|
|
|
|
|
|
|
|
|
|
|
|
|
|
Rental income |
|
$ |
10,729 |
|
|
$ |
10,410 |
|
|
$ |
319 |
|
|
|
3 |
% |
Interest income from mortgage note receivable |
|
|
— |
|
|
|
189 |
|
|
|
(189 |
) |
|
|
-100 |
% |
Tenant recovery revenue |
|
|
87 |
|
|
|
82 |
|
|
|
5 |
|
|
|
6 |
% |
|
|
|
|
|
|
|
|
|
|
|
|
|
Total operating revenues |
|
|
10,816 |
|
|
|
10,681 |
|
|
|
135 |
|
|
|
1 |
% |
|
|
|
|
|
|
|
|
|
|
|
|
|
|
|
|
|
|
|
|
|
|
|
|
|
|
|
|
|
|
Operating expenses |
|
|
|
|
|
|
|
|
|
|
|
|
|
|
|
|
Depreciation and amortization |
|
|
3,475 |
|
|
|
3,390 |
|
|
|
85 |
|
|
|
3 |
% |
Property operating expenses |
|
|
202 |
|
|
|
230 |
|
|
|
(28 |
) |
|
|
-12 |
% |
Due diligence expense |
|
|
131 |
|
|
|
— |
|
|
|
131 |
|
|
|
100 |
% |
Base management fee |
|
|
435 |
|
|
|
296 |
|
|
|
139 |
|
|
|
47 |
% |
Incentive fee |
|
|
840 |
|
|
|
829 |
|
|
|
11 |
|
|
|
1 |
% |
Administration fee |
|
|
260 |
|
|
|
219 |
|
|
|
41 |
|
|
|
19 |
% |
General and administrative |
|
|
357 |
|
|
|
442 |
|
|
|
(85 |
) |
|
|
-19 |
% |
|
|
|
|
|
|
|
|
|
|
|
|
|
Total operating expenses before credit from Adviser |
|
|
5,700 |
|
|
|
5,406 |
|
|
|
294 |
|
|
|
5 |
% |
|
|
|
|
|
|
|
|
|
|
|
|
|
|
|
|
|
|
|
|
|
|
|
|
|
|
|
|
|
|
Credit to incentive fee |
|
|
(445 |
) |
|
|
(56 |
) |
|
|
(389 |
) |
|
|
695 |
% |
|
|
|
|
|
|
|
|
|
|
|
|
|
Total operating expenses |
|
|
5,255 |
|
|
|
5,350 |
|
|
|
(95 |
) |
|
|
-2 |
% |
|
|
|
|
|
|
|
|
|
|
|
|
|
|
|
|
|
|
|
|
|
|
|
|
|
|
|
|
|
|
Other income (expense) |
|
|
|
|
|
|
|
|
|
|
|
|
|
|
|
|
Interest income — employee loans |
|
|
9 |
|
|
|
43 |
|
|
|
(34 |
) |
|
|
-79 |
% |
Other income |
|
|
1 |
|
|
|
5 |
|
|
|
(4 |
) |
|
|
-80 |
% |
Interest expense |
|
|
(4,201 |
) |
|
|
(4,373 |
) |
|
|
172 |
|
|
|
-4 |
% |
|
|
|
|
|
|
|
|
|
|
|
|
|
Total other expense |
|
|
(4,191 |
) |
|
|
(4,325 |
) |
|
|
134 |
|
|
|
-3 |
% |
|
|
|
|
|
|
|
|
|
|
|
|
|
|
|
|
|
|
|
|
|
|
|
|
|
|
|
|
|
|
Net income |
|
|
1,370 |
|
|
|
1,006 |
|
|
|
364 |
|
|
|
36 |
% |
|
|
|
|
|
|
|
|
|
|
|
|
|
|
|
|
|
|
|
|
|
|
|
|
|
|
|
|
|
|
Distributions attributable to preferred stock |
|
|
(1,024 |
) |
|
|
(1,023 |
) |
|
|
(1 |
) |
|
|
0 |
% |
Distributions attributable to senior common stock |
|
|
(15 |
) |
|
|
— |
|
|
|
(15 |
) |
|
|
100 |
% |
|
|
|
|
|
|
|
|
|
|
|
|
|
|
|
|
|
|
|
|
|
|
|
|
|
|
|
|
|
|
Net income (loss) available to common stockholders |
|
$ |
331 |
|
|
$ |
(17 |
) |
|
$ |
348 |
|
|
|
-2047 |
% |
|
|
|
|
|
|
|
|
|
|
|
|
|
29
| |
|
|
|
|
|
|
|
|
|
|
|
|
|
|
|
|
| |
|
For the six months ended June 30, |
|
| |
|
2011 |
|
|
2010 |
|
|
$ Change |
|
|
% Change |
|
| |
|
(Dollars in Thousands) |
|
Operating revenues |
|
|
|
|
|
|
|
|
|
|
|
|
|
|
|
|
Rental income |
|
$ |
21,164 |
|
|
$ |
20,824 |
|
|
$ |
340 |
|
|
|
2 |
% |
Interest income from mortgage note receivable |
|
|
— |
|
|
|
377 |
|
|
|
(377 |
) |
|
|
-100 |
% |
Tenant recovery revenue |
|
|
170 |
|
|
|
165 |
|
|
|
5 |
|
|
|
3 |
% |
|
|
|
|
|
|
|
|
|
|
|
|
|
Total operating revenues |
|
|
21,334 |
|
|
|
21,366 |
|
|
|
(32 |
) |
|
|
0 |
% |
|
|
|
|
|
|
|
|
|
|
|
|
|
|
|
|
|
|
|
|
|
|
|
|
|
|
|
|
|
|
Operating expenses |
|
|
|
|
|
|
|
|
|
|
|
|
|
|
|
|
Depreciation and amortization |
|
|
6,845 |
|
|
|
6,712 |
|
|
|
133 |
|
|
|
2 |
% |
Property operating expenses |
|
|
499 |
|
|
|
474 |
|
|
|
25 |
|
|
|
5 |
% |
Due diligence expense |
|
|
(8 |
) |
|
|
22 |
|
|
|
(30 |
) |
|
|
-136 |
% |
Base management fee |
|
|
787 |
|
|
|
609 |
|
|
|
178 |
|
|
|
29 |
% |
Incentive fee |
|
|
1,672 |
|
|
|
1,675 |
|
|
|
(3 |
) |
|
|
0 |
% |
Administration fee |
|
|
516 |
|
|
|
451 |
|
|
|
65 |
|
|
|
14 |
% |
General and administrative |
|
|
812 |
|
|
|
823 |
|
|
|
(11 |
) |
|
|
-1 |
% |
|
|
|
|
|
|
|
|
|
|
|
|
|
Total operating expenses before credit from Adviser |
|
|
11,123 |
|
|
|
10,766 |
|
|
|
357 |
|
|
|
3 |
% |
|
|
|
|
|
|
|
|
|
|
|
|
|
|
|
|
|
|
|
|
|
|
|
|
|
|
|
|
|
|
Credit to incentive fee |
|
|
(931 |
) |
|
|
(56 |
) |
|
|
(875 |
) |
|
|
1563 |
% |
|
|
|
|
|
|
|
|
|
|
|
|
|
Total operating expenses |
|
|
10,192 |
|
|
|
10,710 |
|
|
|
(518 |
) |
|
|
-5 |
% |
|
|
|
|
|
|
|
|
|
|
|
|
|
|
|
|
|
|
|
|
|
|
|
|
|
|
|
|
|
|
Other income (expense) |
|
|
|
|
|
|
|
|
|
|
|
|
|
|
|
|
Interest income — employee loans |
|
|
19 |
|
|
|
86 |
|
|
|
(67 |
) |
|
|
-78 |
% |
Other income |
|
|
45 |
|
|
|
8 |
|
|
|
37 |
|
|
|
463 |
% |
Interest expense |
|
|
(8,356 |
) |
|
|
(8,657 |
) |
|
|
301 |
|
|
|
-3 |
% |
|
|
|
|
|
|
|
|
|
|
|
|
|
Total other expense |
|
|
(8,292 |
) |
|
|
(8,563 |
) |
|
|
271 |
|
|
|
-3 |
% |
|
|
|
|
|
|
|
|
|
|
|
|
|
|
|
|
|
|
|
|
|
|
|
|
|
|
|
|
|
|
Net income |
|
|
2,850 |
|
|
|
2,093 |
|
|
|
757 |
|
|
|
36 |
% |
|
|
|
|
|
|
|
|
|
|
|
|
|
|
|
|
|
|
|
|
|
|
|
|
|
|
|
|
|
|
Distributions attributable to preferred stock |
|
|
(2,047 |
) |
|
|
(2,047 |
) |
|
|
— |
|
|
|
0 |
% |
Distributions attributable to senior common stock |
|
|
(31 |
) |
|
|
— |
|
|
|
(31 |
) |
|
|
100 |
% |
|
|
|
|
|
|
|
|
|
|
|
|
|
|
|
|
|
|
|
|
|
|
|
|
|
|
|
|
|
|
Net income available to common stockholders |
|
$ |
772 |
|
|
$ |
46 |
|
|
$ |
726 |
|
|
|
1578 |
% |
|
|
|
|
|
|
|
|
|
|
|
|
|
30
Operating Revenues
Rental income increased for both the three and six months ended June 30, 2011, as compared to the
three and six months ended June 30, 2010, because of three properties acquired subsequent to June
30, 2010, partially offset by the lost rental income from two of our properties, which are now
vacant.
Interest income from mortgage notes receivable decreased for both the three and six months ended
June 30, 2011, as compared to the three and six months ended June 30, 2010, as our only mortgage
loan was fully repaid in July 2010.
Tenant recovery revenue increased slightly for both the three and six months ended June 30, 2011,
as compared to the three and six months ended June 30, 2010, because of an increase in insurance
premiums from 2010, resulting in increased reimbursements from our tenants.
Operating Expenses
Depreciation and amortization expenses increased for both the three and six months ended June 30,
2011, as compared to the three and six months ended June 30, 2010, because we acquired three
properties subsequent to June 30, 2010.
Property operating expenses consist of franchise taxes, management fees, insurance, ground lease
payments and overhead expenses paid on behalf of certain of our properties. Property operating
expenses decreased during the three months ended June 30, 2011, as compared to the three months
ended June 30, 2010, because of a decrease in repairs in maintenance incurred during the three
months ended June 30, 2011 versus the three months ended June 30, 2010, partially offset by
overhead expenses for which we are now responsible, which were previously paid directly by our
tenants, at our two vacant properties. Property operating expenses increased during the six months
ended June 30, 2011, as compared to the six months ended June 30, 2010, because of overhead
expenses for which we are now responsible, which were previously paid directly by our tenants, at
our two vacant properties, partially offset by a reduction in repairs in maintenance at certain of
our properties.
Due diligence expense primarily consists of legal fees and fees incurred for third-party reports
prepared in connection with potential acquisitions and our due diligence analyses related thereto.
Due diligence expense increased for the three months ended June 30, 2011, as compared to the three
months ended June 30, 2010, because of costs incurred related to the two acquisitions closed during
the three months ended June 30, 2011 coupled with due diligence costs incurred for deals in our
pipeline. Due diligence expense decreased for the six months ended June 30, 2011, as compared to
the six months ended June 30, 2010, due to an out of period adjustment of $250,000 recorded during
the three months ended March 31, 2011 related to the acquisition of the property in Orange City,
Iowa in December 2010. See Note 1 to our consolidated financial statements included elsewhere in
this Form 10-Q for further detail of the out of period adjustment.
The base management fee increased for the three and six months ended June 30, 2011, as compared to
the three and six months ended June 30, 2010, due to an increase in total common stockholders’
equity from the issuance of common shares during the six months ended June 30, 2011, the main
component of the calculation. The calculation of the base management fee is described in detail
above under “Advisory and Administration Agreements.”
The incentive fee increased for the three months ended June 30, 2011, as compared to the three
months ended June 30, 2010, due to the increase in pre-incentive fee FFO caused by the increase in
rental income from the three properties acquired subsequent to June 30, 2010 coupled with a
reduction in interest expense and general and administrative expenses for the period. The
incentive fee remained relatively flat for the six months ended June 30, 2011, as compared to the
six months ended June 30, 2010, because pre-incentive fee FFO remained flat. The calculation of the
incentive fee is described in detail above under “Advisory and Administration Agreements.”
31
The administration fee increased for the three and six months ended June 30, 2011, as compared to
the three and six months ended June 30, 2010, primarily as a result of an increase in the amount of
the total expenses allocated from our Administrator during the periods, coupled with an increase in
our allocable portion of the total expenses. The calculation of the administration fee is described
in detail above under “Advisory and Administration Agreements.”
General and administrative expenses decreased for the three and six months ended June 30, 2011, as
compared to the three and six months ended June 30, 2010, primarily as a result of a reduction in
legal fees incurred at certain of our properties.
Other Income and Expense
Interest income on employee loans decreased during the three and six months ended June 30, 2011, as
compared to the three and six months ended June 30, 2010. This decrease was a result of loan
payoffs made by employees during 2010 and 2011, coupled with other principal repayments made during
the periods.
Other income decreased during the three months ended June 30, 2011, as compared to the three months
ended June 30, 2010, because of income received during the three months ended June 30, 2010 related
to tax refunds received during the three months ended June 30, 2010 for overpayment of franchise
taxes in certain states. Other income increased during the six months ended June 30, 2011, as
compared to the six months ended June 30, 2010, because of settlement income received from the
previous tenant in our South Hadley, Massachusetts property related to repairs needed for the
parking lot at the building.
Interest expense decreased for the three and six months ended June 30, 2011, as compared to the
three and six months ended June 30, 2010. This decrease was primarily a result of the 2.3%
decrease in the interest rate charged on our $45.2 million mortgage loan that was renewed in
September 2010, coupled with reduced interest expense on our long-term financings from amortizing
principal payments made during 2010 and 2011, partially offset by interest on mortgage debt assumed
in December 2010 and June 2011.
Net Income Available to Common Stockholders
Net income available to common stockholders increased for the three and six months ended June 30,
2011, as compared to the three and six months ended June 30, 2010 primarily because of the out of
period adjustment that was recorded during the three months ended March 31, 2011, coupled with
increased rental income and a decrease in interest expense, as discussed above.
Liquidity and Capital Resources
Overview
Our sources of liquidity include cash flows from operations, cash and cash equivalents, borrowings
under our line of credit, obtaining mortgages on our unencumbered properties and issuing additional
equity securities. Our available liquidity at June 30, 2011 was $34.6 million, including $2.3
million in cash and cash equivalents and an available borrowing capacity of $32.3 million under our
line of credit.
Future Capital Needs
We actively seek conservative investments that are likely to produce income in order to pay
distributions as well as attractive long-term capital gains for our stockholders. If we are able
to raise, procure or borrow additional equity and debt capital, we would intend to use the proceeds
to continue to invest in industrial and commercial real property as well as expand our investment
portfolio into other real property sectors, such as retail and medical properties, make mortgage
loans, repurchase shares of our preferred stock on the open market or pay down outstanding
borrowings under our line of credit. Accordingly, to ensure that we are able to effectively execute
our business strategy, we routinely review our liquidity requirements and continually evaluate all
potential sources of liquidity. Our short-term liquidity needs include proceeds
32
necessary to fund our distributions to stockholders, pay the debt services costs on our existing
long-term mortgages, and fund our current operating costs. Our long-term liquidity needs include
proceeds necessary to grow and maintain our portfolio of investments.
We believe that our available liquidity is sufficient to fund our distributions to stockholders,
pay the debt service costs on our existing long-term mortgages and fund our current operating costs
in the near term. We further believe that our cash flow from operations coupled with the potential
financing capital available to us in the future are sufficient to fund our long-term liquidity
needs. Additionally, to satisfy either our short-term or long-term obligations or both, we may
require credits to our management fees that are issued from our Adviser although our Adviser is
under no obligation to provide any such credits, either in whole or in part.
Equity Capital
Equity capital markets continue to improve. As a result, we were able to raise $3.4 million of
common equity pursuant to our Open Market Sales Agreement with Jefferies during 2010. We have not
sold any common shares under our Open Market Agreement during 2011, however, we raised $14.3
million of common equity in February 2011 and another $22.7 million of common equity in June 2011.
See “Overview — Recent Developments” above. We used these proceeds to repay a portion of the
outstanding balance of the line of credit, to acquire additional properties and the remainder for
general corporate and working capital needs.
Currently, we have the ability to raise up to $257.2 million of additional equity capital through
the sale of securities that are registered under our universal shelf registration statement on Form
S-3 (the “Universal Shelf”) in one or more future public offerings. Of the $257.2 million of
available capacity under our Universal Shelf, $21.6 million of common stock is reserved for
additional sales under our Open Market Sale Agreement and $52.5 million is reserved for sales of
our Senior Common Stock.
Debt
As of June 30, 2011, we had 18 fixed-rate mortgage notes payable in the aggregate principal amount
of $268.0 million, collateralized by a total of 56 properties with terms at issuance ranging from 2
years to 25 years. The weighted-average interest rate on the mortgage notes payable as of June 30,
2011 was 5.68%.
We believe that banks are recommencing their general lending practices and the CMBS market is
returning, see the discussion in “Overview — Business Environment” above. Specifically, we are
beginning to see banks that are willing to issue medium to long-term mortgages, between five and
ten years, albeit on less favorable terms than were previously available. Consequently, we are
focused on obtaining mortgages through both regional banks and CMBS.
We have mortgage debt in the aggregate principal amount of $1.8 million payable during the
remainder of 2011 and $4.0 million payable during 2012. This does not include $45.2 million of
balloon principal payments maturing on one of our long-term mortgages in 2011; however, this
mortgage has two remaining annual extension options through 2013, and we intend to exercise one of
these options in 2011. As long as we are in compliance with certain covenants under the mortgage
loan, we will be able to exercise the renewal option. The mortgage payments due in 2011 and 2012
are solely comprised of debt amortization payments. We have no balloon principal payments due under
any of our other mortgage loans until 2013. We intend to pay the debt amortization payments from
operating cash flow and borrowings under our line of credit.
Operating Activities
Net cash provided by operating activities during the six months ended June 30, 2011 was $9.6
million, as compared to net cash provided by operating activities of $7.1 million for the six
months ended June 30, 2010. This increase was primarily a result of the $750,000 lease
modification fee received from the tenant located in our properties in Georgia in connection with
the extension of their lease in January 2011,
33
coupled with rental income received from the three properties acquired subsequent to June 30, 2010,
and expenses incurred during the six months ended June 30, 2010 related to our terminated offering
of our unregistered senior common stock, which were not incurred in 2011. This was partially
offset by the two vacancies in our properties, coupled with the lost interest income from the
repayment of our mortgage loan in 2010. The majority of cash from operating activities is
generated from the rental payments that we receive from our tenants. We utilize this cash to fund
our property-level operating expenses and use the excess cash primarily for debt and interest
payments on our mortgage notes payable, interest payments on our line of credit, distributions to
our stockholders, management fees to our Adviser, and other entity-level expenses.
Investing Activities
Net cash used in investing activities during the six months ended June 30, 2011 was $16.4 million,
which primarily consisted of the acquisition of two properties in 2011, coupled with tenant
improvements performed at certain of our properties and net payments to our lenders for reserves,
as compared to net cash used in investing activities during the six months ended June 30, 2010 of
$238,000 which primarily consisted of net receipts from lenders for reserves and a decrease in the
amount of our restricted cash, partially offset by tenant improvements performed at certain of our
properties.
Financing Activities
Net cash provided by financing activities for the six months ended June 30, 2011 was $2.1 million,
which primarily consisted of proceeds from the sale of common stock, partially offset by
distributions paid to our stockholders, principal repayments on mortgage notes payable and net
repayments on our line of credit. Net cash used in financing activities for the six months ended
June 30, 2010 was $7.1 million, which primarily consisted of distributions paid to our stockholders
and principal repayments on mortgage notes payable, partially offset by net borrowings from our
line of credit.
Line of Credit
In December 2010, we procured a $50.0 million line of credit maturing on December 28, 2013, with
Capital One, N.A. serving as a revolving lender, a letter of credit issuer and as an administrative
agent and Branch Banking and Trust Company serving as a revolving lender and a letter of credit
issuer. The line of credit provides for a senior secured revolving credit facility of up to $50.0
million, with a standby letter of credit sublimit of up to $20.0 million. The line of credit may,
upon satisfaction of certain conditions, be expanded up to $75.0 million. Currently, nine of our
properties are pledged as collateral under our line of credit. The interest rate per annum
applicable to the line of credit is equal to the London Interbank Offered Rate, or LIBOR, plus an
applicable margin of up to 3.00% depending upon our leverage. Our leverage ratio used in
determining the applicable margin for interest on the line of credit is recalculated quarterly. We
are subject to an annual maintenance fee of 0.25% per year. Our ability to access this source of
financing is subject to our continued ability to meet customary lending requirements such as
compliance with financial and operating covenants and our meeting certain lending limits. One such
covenant requires us to limit distributions to our stockholders to 95% of our FFO, with
acquisition-related costs required to be expensed under ASC 805 added back to FFO. In addition, the
maximum amount that we may draw under this agreement is based on a percentage of the value of
properties pledged as collateral to the banks, which must meet agreed upon eligibility standards.
If and when we are able to procure long-term mortgages for these pledged properties, the banks will
release the properties from the line of credit and reduce the availability under the line of credit
by the advanced amount of the released property. Conversely, as we purchase new properties meeting
the eligibility standards, we may pledge these new properties to obtain additional advances under
this agreement. Our availability under the line of credit will also be reduced by letters of
credit used in the ordinary course of business. We may use the advances under the line of credit
for both general corporate purposes and the acquisition of new investments.
34
At June 30, 2011, there was $8.2 million outstanding under the line of credit at an interest rate
of 3.2% and $5.1 million outstanding under letters of credit at a weighted average interest rate of
3.0%. At June 30, 2011, the remaining borrowing capacity available under the line of credit was
$32.3 million. Our ability to increase the availability under our line of credit is dependent upon
our pledging additional properties as collateral. Traditionally, we have pledged new properties to
the line of credit as we arrange for long-term mortgages for these pledged properties. Currently,
only eleven of our properties do not have long-term mortgages, and nine of those are pledged as
collateral under our line of credit. Accordingly, we have only two properties which are
unencumbered, and which may be pledged as collateral to increase the borrowing capacity available
under the line of credit. We were in compliance with all covenants under the line of credit as of
June 30, 2011.
Contractual Obligations
The following table reflects our material contractual obligations as of June 30, 2011:
| |
|
|
|
|
|
|
|
|
|
|
|
|
|
|
|
|
|
|
|
|
| |
|
Payments Due by Period (Dollars in Thousands) |
|
| Contractual Obligations |
|
Total |
|
|
Less than 1 Year |
|
|
1-3 Years |
|
|
3-5 Years |
|
|
More than 5 Years |
|
Debt Obligations (1) |
|
|
276,200 |
|
|
$ |
48,988 |
|
|
$ |
42,486 |
|
|
$ |
105,551 |
|
|
$ |
79,175 |
|
Interest on Debt Obligations (2) |
|
|
66,642 |
|
|
|
14,082 |
|
|
|
26,585 |
|
|
|
19,607 |
|
|
|
6,368 |
|
Capital Lease Obligations (3) |
|
|
300 |
|
|
|
— |
|
|
|
300 |
|
|
|
— |
|
|
|
— |
|
Operating Lease Obligations (4) |
|
|
1,527 |
|
|
|
153 |
|
|
|
305 |
|
|
|
305 |
|
|
|
764 |
|
|
|
|
|
|
|
|
|
|
|
|
|
|
|
|
|
Total |
|
$ |
344,669 |
|
|
$ |
63,223 |
|
|
$ |
69,676 |
|
|
$ |
125,463 |
|
|
$ |
86,307 |
|
|
|
|
|
|
|
|
|
|
|
|
|
|
|
|
|
|
|
|
| (1) |
|
Debt obligations represent borrowings under our line of credit, which
represents $8,200 of the debt obligation due in 2013, and mortgage notes payable
that were outstanding as of June 30, 2011. The $45,233 mortgage note issued in
September 2008 matures in October 2011, and we expect to exercise each of our
options to extend the maturity date until October 2013. |
| |
| (2) |
|
Interest on debt obligations includes estimated interest on our borrowings under our
line of credit. The balance and interest rate on our line of credit is variable;
thus, the amount of interest calculated for purposes of this table was based upon rates and
balances as of June 30, 2011. |
| |
| (3) |
|
Capital lease obligations represent the obligation to purchase the land held under the ground
lease on our property located in Fridley, Minnesota. |
| |
| (4) |
|
Operating lease obligations represent the ground lease payments due on our Tulsa, Oklahoma
property, which expires in June 2021. |
Off-Balance Sheet Arrangements
We did not have any off-balance sheet arrangements as of June 30, 2011.
35
Funds from Operations
The National Association of Real Estate Investment Trusts, or NAREIT, developed FFO as a relative
non-GAAP supplemental measure of operating performance of an equity REIT, in order to recognize
that income-producing real estate historically has not depreciated on the same basis determined
under GAAP. FFO, as defined by NAREIT, is net income (computed in accordance with GAAP), excluding
gains or losses from sales of property, plus depreciation and amortization of real estate assets,
and after adjustments for unconsolidated partnerships and joint ventures.
FFO does not represent cash flows from operating activities in accordance with GAAP, which, unlike
FFO, generally reflects all cash effects of transactions and other events in the determination of
net income and should not be considered an alternative to net income as an indication of our
performance or to cash flows from operations as a measure of liquidity or ability to make
distributions. Comparison of FFO, using the NAREIT definition, to similarly titled measures for
other REITs may not necessarily be meaningful due to possible differences in the application of the
NAREIT definition used by such REITs.
FFO available to common stockholders is FFO adjusted to subtract distributions made to holders of
preferred and senior common stock. We believe that net income available to common stockholders is
the most directly comparable GAAP measure to FFO available to common stockholders.
Basic funds from operations per share, or Basic FFO per share, and diluted funds from operations
per share, or Diluted FFO per share, is FFO available to common stockholders divided by the number
of weighted average shares of common stock outstanding and FFO available to common stockholders
divided by the number of weighted average shares of common stock outstanding on a diluted basis,
respectively, during a period. We believe that FFO available to common stockholders, Basic FFO per
share and Diluted FFO per share are useful to investors because they provide investors with a
further context for evaluating our FFO results in the same manner that investors use net income and
earnings per share, or EPS, in evaluating net income available to common stockholders. In addition,
because most REITs provide FFO available to common stockholders, Basic FFO and Diluted FFO per
share information to the investment community, we believe these are useful supplemental measures
when comparing us to other REITs. We believe that net income is the most directly comparable GAAP
measure to FFO, Basic EPS is the most directly comparable GAAP measure to Basic FFO per share, and
that diluted EPS is the most directly comparable GAAP measure to Diluted FFO per share.
36
The following table provides a reconciliation of our FFO for the three and six months ended June
30, 2011 and 2010, to the most directly comparable GAAP measure, net income, and a computation of
basic and diluted FFO per weighted average share of common stock and basic and diluted net income
per weighted average share of common stock:
| |
|
|
|
|
|
|
|
|
| |
|
For the three months ended June 30, |
|
| |
|
2011 |
|
|
2010 |
|
| |
|
(Dollars in Thousands, Except Per Share Data) |
|
Net income |
|
$ |
1,370 |
|
|
$ |
1,006 |
|
Less: Distributions attributable to preferred and senior common stock |
|
|
(1,039 |
) |
|
|
(1,023 |
) |
|
|
|
|
|
|
|
Net income (loss) available to common stockholders |
|
|
331 |
|
|
|
(17 |
) |
|
|
|
|
|
|
|
|
|
Add: Real estate depreciation and amortization |
|
|
3,475 |
|
|
|
3,390 |
|
|
|
|
|
|
|
|
FFO available to common stockholders |
|
$ |
3,806 |
|
|
$ |
3,373 |
|
|
|
|
|
|
|
|
|
|
Weighted average shares outstanding — basic |
|
|
9,782 |
|
|
|
8,545 |
|
Weighted average shares outstanding — diluted |
|
|
9,834 |
|
|
|
8,545 |
|
|
|
|
|
|
|
|
|
|
Basic net income per weighted average share of common stock |
|
$ |
0.04 |
|
|
$ |
0.00 |
|
|
|
|
|
|
|
|
Diluted net income per weighted average share of common stock |
|
$ |
0.04 |
|
|
$ |
0.00 |
|
|
|
|
|
|
|
|
|
|
|
|
|
|
|
|
|
Basic FFO per weighted average share of common stock |
|
$ |
0.39 |
|
|
$ |
0.39 |
|
|
|
|
|
|
|
|
Diluted FFO per weighted average share of common stock |
|
$ |
0.39 |
|
|
$ |
0.39 |
|
|
|
|
|
|
|
|
|
|
|
|
|
|
|
|
|
Distributions declared per share of common stock |
|
$ |
0.375 |
|
|
$ |
0.375 |
|
|
|
|
|
|
|
|
|
|
|
|
|
|
|
|
|
Percentage of FFO paid per share of common stock |
|
|
95 |
% |
|
|
95 |
% |
|
|
|
|
|
|
|
| |
|
|
|
|
|
|
|
|
| |
|
For the six months ended June 30, |
|
| |
|
2011 |
|
|
2010 |
|
| |
|
(Dollars in Thousands, Except Per Share Data) |
|
Net income |
|
$ |
2,850 |
|
|
$ |
2,093 |
|
Less: Distributions attributable to preferred and senior common stock |
|
|
(2,078 |
) |
|
|
(2,047 |
) |
|
|
|
|
|
|
|
Net income available to common stockholders |
|
|
772 |
|
|
|
46 |
|
|
|
|
|
|
|
|
|
|
Add: Real estate depreciation and amortization |
|
|
6,845 |
|
|
|
6,712 |
|
|
|
|
|
|
|
|
FFO available to common stockholders |
|
$ |
7,617 |
|
|
$ |
6,758 |
|
|
|
|
|
|
|
|
|
|
Weighted average shares outstanding — basic |
|
|
9,522 |
|
|
|
8,552 |
|
Weighted average shares outstanding — diluted |
|
|
9,573 |
|
|
|
8,553 |
|
|
|
|
|
|
|
|
|
|
Basic net income per weighted average share of common stock |
|
$ |
0.08 |
|
|
$ |
0.01 |
|
|
|
|
|
|
|
|
Diluted net income per weighted average share of common stock |
|
$ |
0.08 |
|
|
$ |
0.01 |
|
|
|
|
|
|
|
|
|
|
|
|
|
|
|
|
|
Basic FFO per weighted average share of common stock |
|
$ |
0.80 |
|
|
$ |
0.79 |
|
|
|
|
|
|
|
|
Diluted FFO per weighted average share of common stock |
|
$ |
0.80 |
|
|
$ |
0.79 |
|
|
|
|
|
|
|
|
|
|
|
|
|
|
|
|
|
Distributions declared per share of common stock |
|
$ |
0.750 |
|
|
$ |
0.750 |
|
|
|
|
|
|
|
|
|
|
|
|
|
|
|
|
|
Percentage of FFO paid per share of common stock |
|
|
94 |
% |
|
|
95 |
% |
|
|
|
|
|
|
|
37
Item 3. Quantitative and Qualitative Disclosures about Market Risk
Market risk includes risks that arise from changes in interest rates, foreign currency exchange
rates, commodity prices, equity prices and other market changes that affect market sensitive
instruments. The primary risk that we believe we are and will be exposed to is interest rate risk.
Certain of our leases contain escalations based on market interest rates, and the interest rate on
our existing line of credit is variable. Although we seek to mitigate this risk by structuring
such provisions of our loans and leases to contain a minimum interest rate or escalation rate, as
applicable, these features do not eliminate this risk. We have not entered into any derivative
contracts to attempt to further manage our exposure to interest rate fluctuations.
To illustrate the potential impact of changes in interest rates on our net income for the three and
six months ended June 30, 2011, we have performed the following analysis, which assumes that our
balance sheet remains constant and that no further actions beyond a minimum interest rate or
escalation rate are taken to alter our existing interest rate sensitivity.
The following table summarizes the impact of a 1%, 2% and 3% increase in the one month LIBOR for
the three months ended June 30, 2011. As of June 30, 2011, our effective average LIBOR was 0.19%;
thus, a 1% decrease could not occur.
| |
|
|
|
|
|
|
|
|
|
|
|
|
| |
|
(Dollars in Thousands) |
| |
|
Increase to Rental |
|
Increase to Interest |
|
Net Decrease to |
| Interest Rate Change |
|
Income |
|
Expense |
|
Net Income |
1% Increase to LIBOR |
|
$ |
— |
|
|
$ |
35 |
|
|
$ |
(35 |
) |
2% Increase to LIBOR |
|
|
— |
|
|
|
71 |
|
|
|
(71 |
) |
3% Increase to LIBOR |
|
|
1 |
|
|
|
106 |
|
|
|
(105 |
) |
As of June 30, 2011, the fair value of our fixed rate debt outstanding was $261.1 million.
Interest rate fluctuations may affect the fair value of our fixed rate debt instruments. If
interest rates on our fixed rate debt instruments, using rates at June 30, 2011, had been one
percentage point higher or lower, the fair value of those debt instruments on that date would have
decreased or increased by $8.7 million and $9.2 million, respectively.
In the future, we may be exposed to additional effects of interest rate changes, primarily as a
result of our line of credit or long-term mortgage debt, which we use to maintain liquidity and
fund expansion of our real estate investment portfolio and operations. Our interest rate risk
management objectives are to limit the impact of interest rate changes on earnings and cash flows
and to lower overall borrowing costs. To achieve these objectives, we will borrow primarily at
fixed rates or variable rates with the lowest margins available and, in some cases, with the
ability to convert variable rates to fixed rates. We may also enter into derivative financial
instruments such as interest rate swaps and caps in order to mitigate the interest rate risk on a
related financial instrument. We will not enter into derivative or interest rate transactions for
speculative purposes.
In addition to changes in interest rates, the value of our real estate is subject to fluctuations
based on changes in local and regional economic conditions and changes in the creditworthiness of
lessees and borrowers, all of which may affect our ability to refinance debt if necessary.
38
Item 4. Controls and Procedures
a) Evaluation of Disclosure Controls and Procedures
As of June 30, 2011, our management, including our chief executive officer and chief financial
officer, evaluated the effectiveness of the design and operation of our disclosure controls and
procedures (as defined in Exchange Act Rules 13a-15(e) and 15d-15(e)). Based on that evaluation,
management, including the chief executive officer and chief financial officer, concluded that our
disclosure controls and procedures were effective as of June 30, 2011 in providing a reasonable
level of assurance that information we are required to disclose in reports that we file or submit
under the Exchange Act is recorded, processed, summarized, and reported within the time periods
specified in applicable SEC rules and forms, including providing a reasonable level of assurance
that information required to be disclosed by us in such reports is accumulated and communicated to
our management, including our chief executive officer and our chief financial officer, as
appropriate to allow timely decisions regarding required disclosure. However, in evaluating the
disclosure controls and procedures, management recognized that any controls and procedures, no
matter how well designed and operated can provide only reasonable assurance of necessarily
achieving the desired control objectives, and management was required to apply its judgment in
evaluating the cost-benefit relationship of possible controls and procedures.
b) Changes in Internal Control over Financial Reporting
There were no changes in our internal control over financial reporting that occurred during the
quarter ended June 30, 2011 that have materially affected, or are reasonably likely to materially
affect, our internal control over financial reporting.
39
PART II — OTHER INFORMATION
Item 1. Legal Proceedings
Neither we nor any of our subsidiaries are currently subject to any material legal proceedings,
nor, to our knowledge, is any material legal proceeding threatened against us or our subsidiaries.
Item 1A. Risk Factors
Our business is subject to certain risks and events that, if they occur, could adversely affect our
financial condition and results of operations and the trading price of our common stock. For a
discussion of these risks, please review the risk below and refer to the section captioned “Item 1A. Risk Factors” in our
Annual Report on Form 10-K for the year ended December 31, 2010, filed by us with the Securities
and Exchange Commission on March 8, 2011.
Recent delays by U.S. lawmakers to reach an agreement
on the national debt ceiling and the uncertainty if lawmakers will be able to implement a budget may materially
adversely affect our business, financial condition and results of operations.
The current U.S. debt ceiling and budget deficit concerns have increased the possibility of
the credit-rating agencies downgrading the U.S.'s credit rating for the first time in
history. While U.S. lawmakers were able to reach an agreement and raise the national
debt ceiling, there is still uncertainty about whether the U.S. can implement the budget
and thus the U.S. could still default on its obligations in the future. Such a default,
the perceived risk of such a default or a downgrade of the U.S.’s credit rating
consequently could have a material adverse effect on the financial markets and
economic conditions in the U.S. and throughout the world. This could negatively
affect our ability to obtain financing for our investments and limit our ability to
utilize certain of our current borrowings. In addition, we may have difficulty releasing
our properties or collecting rent from tenants that may rely on any funding that is cut
by our government. As a result, this could adversely affect our business, financial
condition and results of operations.
Item 2. Unregistered Sales of Equity Securities and Use of Proceeds
Not applicable.
Item 3. Defaults Upon Senior Securities
Not applicable.
Item 4. Removed and Reserved
Item 5. Other Information
Not applicable.
40
Item 6. Exhibits
Exhibit Index
| |
|
|
| Exhibit |
|
|
| Number |
|
Exhibit Description |
3.1
|
|
Articles of Amendment and Restatement to Articles of Incorporation of
the Registrant, incorporated by reference to Exhibit 3.1 to the
Registrant’s Registration Statement on Form S-11 (File No. 333-106024),
filed June 11, 2003. |
|
|
|
3.1.1
|
|
Articles Supplementary of the Registrant Establishing and Fixing the
Rights and Preferences of the 7.75% Series A Cumulative Redeemable
Preferred Stock, incorporated by reference to Exhibit 3.3 of the
Registrant’s Form 8-A12G (File No. 000-50363), filed January 19, 2006. |
|
|
|
3.1.2
|
|
Articles of Amendment to Articles Supplementary of the Registrant
Establishing and Fixing the Rights and Preferences of 7.75% Series A
Cumulative Redeemable Preferred Stock, incorporated by reference to
Exhibit 99.1 of the Registrant’s Form 8-K, filed on April 13, 2006. |
|
|
|
3.1.3
|
|
Articles Supplementary of the Registrant Establishing and Fixing the
Rights and Preferences of the 7.5% Series B Cumulative Redeemable
Preferred Stock, incorporated by reference to Exhibit 3.4 of the
Registrant’s Form 8-A12B (File No. 000-50363), filed October 19, 2006. |
|
|
|
3.1.4
|
|
Articles of Amendment to Articles of Amendment and Restatement to
Articles of Incorporation of the Registrant, incorporated by reference
to Exhibit 3.1.1 to the Registrant’s Quarterly Report on Form 10-Q,
filed July 30, 2009. |
|
|
|
3.1.5
|
|
Articles Supplementary of the Registrant, incorporated by reference to
Exhibit 3.1 to the Registrant’s Current Report on Form 8-K, filed March
19, 2010. |
|
|
|
3.1.6
|
|
Articles Supplementary of the Registrant, incorporated by reference to
Exhibit 3.1 of the Registrant’s Current Report on Form 8-K, filed
September 9, 2010. |
|
|
|
3.1.7
|
|
Articles Supplementary of the Registrant, incorporated by reference to
Exhibit 3.2 of the Registrant’s Current Report on Form 8-K, filed
September 9, 2010. |
|
|
|
3.2
|
|
Bylaws of the Registrant, incorporated by reference to Exhibit 3.2 to
the Registration Statement on Form S-11 (File No. 333-106024), filed
June 11, 2003. |
|
|
|
3.2.1
|
|
First Amendment to Bylaws of the Registrant, incorporated by reference
to Exhibit 99.1 of the Registrant’s Current Report on Form 8-K, filed
July 10, 2007. |
|
|
|
4.1
|
|
Form of Certificate for Common Stock of the Registrant, incorporated by
reference to Exhibit 4.1 to the Registrant’s Registration Statement on
Form S-11 (File No. 333-106024), filed August 8, 2003. |
|
|
|
4.2
|
|
Form of Certificate for 7.75% Series A Cumulative Redeemable Preferred
Stock of the Registrant, incorporated by reference to Exhibit 4.1 of
the Registrant’s Form 8-A12G (File No. 000-50363), filed January 19,
2006. |
|
|
|
4.3
|
|
Form of Certificate for 7.5% Series B Cumulative Redeemable Preferred
Stock of the Registrant, incorporated by reference to Exhibit 4.2 of
the Registrant’s Form 8-A12B (File No. 001-33097), filed October 19,
2006. |
|
|
|
10.1
|
|
Underwriting Agreement, dated June 10, 2011, incorporated by reference
to Exhibit 1.1 of |
41
| |
|
|
| Exhibit |
|
|
| Number |
|
Exhibit Description |
|
|
the Registrant’s Current Report on Form 8-K, filed on
June 10, 2011. |
|
|
|
11
|
|
Computation of Per Share Earnings from Operations of the Registrant
(included in the notes to the unaudited financial statements contained
in this Report. |
|
|
|
12
|
|
Statements re: computation of ratios of the Registrant (filed herewith). |
|
|
|
31.1
|
|
Certification of Chief Executive Officer pursuant to Section 302 of The
Sarbanes-Oxley Act of 2002 (filed herewith). |
|
|
|
31.2
|
|
Certification of Chief Financial Officer pursuant to Section 302 of The
Sarbanes-Oxley Act of 2002 (filed herewith). |
|
|
|
32.1
|
|
Certification of Chief Executive Officer pursuant to Section 906 of The
Sarbanes-Oxley Act of 2002 (furnished herewith). |
|
|
|
32.2
|
|
Certification of Chief Financial Officer pursuant to Section 906 of The
Sarbanes-Oxley Act of 2002 (furnished herewith). |
|
|
|
101.INS***
|
|
XBRL Instance Document |
|
|
|
101.SCH***
|
|
XBRL Taxonomy Extension Schema Document |
|
|
|
101.CAL***
|
|
XBRL Taxonomy Extension Calculation Linkbase Document |
|
|
|
101.LAB***
|
|
XBRL Taxonomy Extension Label Linkbase Document |
|
|
|
101.PRE***
|
|
XBRL Taxonomy Extension Presentation Linkbase Document |
|
|
|
| *** |
|
The following financial information of the Registrant for the
quarter ended June 30, 2011, formatted in XBRL (eXtensible Business Reporting Language): (i) Consolidated
Balance Sheets (unaudited), (ii) Consolidated Statements of Operations (unaudited), (iii) Consolidated Statements
of Cash Flows (unaudited) and (iv) Notes to Consolidated Financial Statements (unaudited).
Pursuant to Rule 406T of Regulation S-T, the Interactive Data Files on Exhibit 101 hereto are
deemed not filed or part of a registration statement or prospectus for purposes of Sections 11 or 12 of
the Securities Act of 1933, as amended, are deemed not filed for purposes of Section 18 of the Securities
and Exchange Act of 1934, as amended, and otherwise are not subject to liability under those sections. |
42
SIGNATURES
Pursuant to the requirements of Section 13 or 15(d) of the Securities Exchange Act of 1934, the
registrant has duly caused this report to be signed on its behalf by the undersigned, thereunto
duly authorized.
| |
|
|
|
|
| |
Gladstone Commercial Corporation
|
|
| Date: August 2, 2011 |
By: |
/s/ Danielle Jones
|
|
| |
|
Danielle Jones |
|
| |
|
Chief Financial Officer |
|
| |
43