UNITED STATES
SECURITIES AND EXCHANGE COMMISSION
WASHINGTON, D.C. 20549
FORM 10-K
| x | ANNUAL REPORT PURSUANT TO SECTION 13 OR 15(d) OF THE SECURITIES EXCHANGE ACT OF 1934 FOR THE FISCAL YEAR ENDED DECEMBER 31, 2011 |
For the fiscal year ended December 31, 2011
OR
| ¨ | TRANSITION REPORT PURSUANT TO SECTION 13 OR 15(d) OF THE SECURITIES EXCHANGE ACT OF 1934 |
COMMISSION FILE NUMBER: 001-33097
GLADSTONE COMMERCIAL CORPORATION
(Exact name of registrant as specified in its charter)
| MARYLAND | 02-0681276 | |
| (State or other jurisdiction of incorporation or organization) |
(I.R.S. Employer Identification No.) |
1521 WESTBRANCH DRIVE, SUITE 200
MCLEAN, VIRGINIA 22102
(Address of principal executive office)
(703) 287-5800
(Registrant’s telephone number, including area code)
Securities registered pursuant to Section 12(b) of the Act:
| (Title of Each Class) |
(Name of exchange on which registered) | |
| Common Stock, par value $0.001 per share | NASDAQ Global Select Market | |
| 7.75% Series A Cumulative Redeemable Preferred Stock, par value $0.001 per share |
NASDAQ Global Select Market | |
| 7.50% Series B Cumulative Redeemable Preferred Stock, par value $0.001 per share |
NASDAQ Global Select Market | |
| 7.125% Series C Cumulative Term Preferred Stock, par value $0.001 per share |
NASDAQ Global Select Market |
Securities registered pursuant to Section 12(g) of the Act:
None
Indicate by check if the registrant is a well-known seasoned issuer, as defined in Rule 405 of the Securities Act. Yes ¨ No x.
Indicate by check if the registrant is not required to file reports pursuant to Section 13 or Section 15(d) of the Act. Yes ¨ No x.
Indicate by check mark whether the registrant (1) has filed all reports required to be filed by Section 13 or 15(d) of the Securities Exchange Act of 1934 during the preceding 12 months (or for such shorter period that the registrant was required to file such reports), and (2) has been subject to such filing requirements for the past 90 days. Yes x No ¨.
Indicate by check mark whether the registrant has submitted electronically and posted on its corporate Web site, if any, every Interactive Data File required to be submitted and posted pursuant to Rule 405 of Regulation S-T during the preceding 12 months (or for such shorter period that the registrant was required to submit and post such files). Yes x No ¨.
Indicate by check mark if disclosure of delinquent filers pursuant to Item 405 of Regulation S-K is not contained herein, and will not be contained, to the best of registrant’s knowledge, in definitive proxy or information statements incorporated by reference in Part III of this Form 10-K or any amendment to this Form 10-K. x
Indicate by check mark whether the registrant is a large accelerated filer, an accelerated filer, a non-accelerated filer, or a smaller reporting company. See the definitions of “large accelerated filer,” “accelerated filer” and “smaller reporting company” in Rule 12b-2 of the Exchange Act. (Check one):
| Large Accelerated Filer | ¨ | Accelerated Filer | x | |||
| Non-Accelerated Filer | ¨ (Do not check if a smaller reporting company) | Smaller Reporting Company | ¨. | |||
Indicate by check mark whether the registrant is a shell company (as defined in Rule 12b-2 of the Exchange Act). Yes ¨ No x.
The aggregate market value of the voting stock held by non-affiliates of the registrant on June 30, 2011, based on the closing price on that date of $17.33 on the NASDAQ Global Select Market, was $178,220,819. For the purposes of calculating this amount only, all directors and executive officers of the registrant have been deemed to be affiliates.
The number of shares of the registrant’s Common Stock, $0.001 par value, outstanding as of February 28, 2012 was 10,945,379.
Documents Incorporated by Reference: Portions of the registrant’s Proxy Statement relating to the Registrant’s 2012 Annual Meeting of Stockholders are incorporated by reference into Part III of this Annual Report on Form 10-K.
GLADSTONE COMMERCIAL CORPORATION
FORM 10-K FOR THE YEAR ENDED
DECEMBER 31, 2011
2
Forward-Looking Statements
Our disclosure and analysis in this Annual Report on Form 10-K, or Form 10-K, and the documents that are incorporated by reference herein, contain “forward-looking statements” within the meaning of Section 27A of the Securities Act of 1933, as amended, or Securities Act, and Section 21E of the Securities Exchange Act of 1934, as amended, or Exchange Act. Forward-looking statements provide our current expectations or forecasts of future events and are not statements of historical fact. These forward-looking statements include information about possible or assumed future events, including, among other things, discussion and analysis of our future financial condition, results of operations and funds from operations, or FFO, our strategic plans and objectives, cost management, occupancy and leasing rates and trends, liquidity and ability to refinance our indebtedness as it matures, anticipated capital expenditures (and access to capital) required to complete projects, amounts of anticipated cash distributions to our stockholders in the future and other matters. Words such as “anticipates,” “expects,” “intends,” “plans,” “believes,” “seeks,” “estimates” and variations of these words and similar expressions are intended to identify forward-looking statements. These statements are not guarantees of future performance and are subject to risks, uncertainties and other factors, some of which are beyond our control, are difficult to predict and could cause actual results to differ materially from those expressed or forecasted in the forward-looking statements. Statements regarding the following subjects, among others, are forward-looking by their nature:
| • | our business and financing strategy; |
| • | our ability to implement our business plan; |
| • | pending transactions; |
| • | our projected operating results; |
| • | our ability to obtain future financing arrangements; |
| • | estimates relating to our future distributions; |
| • | our understanding of our competition and our ability to compete effectively; |
| • | market and industry trends; |
| • | interest and insurance rates; |
| • | estimates of our future operating expenses, including payments to our Adviser (as defined herein) under the terms of our Advisory Agreement (as defined herein); |
| • | projected capital expenditures; and |
| • | use of the proceeds of our Line of Credit (as defined herein), mortgage notes payable and other future capital resources, if any. |
Forward-looking statements involve inherent uncertainty and may ultimately prove to be incorrect or false. You are cautioned to not place undue reliance on forward-looking statements. Except as otherwise may be required by law, we undertake no obligation to update or revise forward-looking statements to reflect changed assumptions, the occurrence of unanticipated events or actual operating results. Our actual results could differ materially from those anticipated in these forward-looking statements as a result of various factors, including, but not limited to:
| • | general volatility of the capital markets and the market price of our common and preferred stock; |
3
| • | risks associated with negotiation and consummation of pending and future transactions; |
| • | changes in our business strategy; |
| • | the adequacy of our cash reserves and working capital; |
| • | our failure to successfully integrate and operate acquired properties and operations; |
| • | defaults upon or non-renewal of leases by tenants; |
| • | decreased rental rates or increased vacancy rates; |
| • | the degree and nature of our competition; |
| • | availability, terms and deployment of capital, including the ability to maintain and borrow under our Line of Credit, arrange for long-term mortgages on our properties, secure one or more additional long-term lines of credit and raise equity capital; |
| • | our ability to identify, hire and retain highly-qualified personnel in the future; |
| • | changes in our industry or the general economy; |
| • | changes in real estate and zoning laws and increases in real property tax rates; |
| • | changes in governmental regulations, tax rates and similar matters; |
| • | environmental uncertainties and risks related to natural disasters; and |
| • | the loss of any of our key employees, such as Mr. David Gladstone, our Chairman and Chief Executive Officer, Mr. Terry Lee Brubaker, our Vice Chairman and Chief Operating Officer, or Mr. George Stelljes III, our President and Chief Investment Officer. |
This list of risks and uncertainties, however, is only a summary of some of the most important factors to us and is not intended to be exhaustive. You should carefully review the risks set forth herein under the caption “Item 1A. Risk Factors.” New factors may also emerge from time to time that could materially and adversely affect us.
Overview
Gladstone Commercial Corporation (which we refer to as “we,” “us,” or the “Company,”) is a real estate investment trust, or REIT, that was incorporated under the General Corporation Laws of the State of Maryland on February 14, 2003 primarily for the purpose of investing in and owning net leased industrial, commercial and retail real property and selectively making long-term industrial and commercial mortgage loans. Our portfolio of real estate is leased to a wide cross section of tenants ranging from small businesses to large public companies, many of which are corporations that do not have publicly rated debt. We have in the past entered into, and intend in the future to enter into, purchase agreements for real estate having triple net leases with terms of approximately 10 to 15 years and built in rental increases. Under a triple net lease, the tenant is required to pay all operating, maintenance and insurance costs and real estate taxes with respect to the leased property. As of February 28, 2012, we own a total of 73 properties.
We conduct substantially all of our activities, including the ownership of all of our properties, through Gladstone Commercial Limited Partnership, a Delaware limited partnership, which we refer to as our
4
Operating Partnership. We control our Operating Partnership through our ownership of GCLP Business Trust II, a Massachusetts business trust, which is the general partner of our Operating Partnership, and of GCLP Business Trust I, a Massachusetts business trust, which currently holds all of the limited partnership units of our Operating Partnership. We expect that our Operating Partnership may issue limited partnership units from time to time in exchange for industrial and commercial real property. Limited partners who hold limited partnership units in our Operating Partnership will generally be entitled to redeem these units for cash or, at our election, shares of our common stock on a one-for-one basis.
Our Operating Partnership is also the sole member of Gladstone Commercial Lending, LLC, which we refer to as Gladstone Commercial Lending. Gladstone Commercial Lending is a Delaware limited liability company that was formed to hold all of our real estate mortgage loans.
Our business is managed by our external adviser, Gladstone Management Corporation, or our Adviser.
Our Investment Objectives and Our Strategy
Our principal investment objectives are to generate income from rental properties and, to a much lesser extent, mortgage loans, which we use to fund our continuing operations and to pay out monthly cash distributions to our stockholders. We intend to grow the distribution to stockholders over time, and to increase the value of our common stock. Our primary strategy to achieve our investment objectives is to invest in and own a diversified portfolio of leased industrial and commercial real estate that we believe will produce stable cash flow and increase in value. We expect to sell some of our real estate assets from time to time when our Adviser determines that doing so would be advantageous to us and our stockholders. We also expect to occasionally make mortgage loans secured by income-producing commercial or industrial real estate, which loans may have some form of equity participation. We currently have no investments in mortgage loans.
We use leverage to make more investments than would otherwise be possible in order to maximize potential returns to stockholders. We are not limited with respect to the amount of leverage that we may use for the acquisition of any specific property. We intend to use non-recourse mortgage financing that will allow us to limit our loss exposure on any property to the amount of equity invested in such property. The market for long-term mortgages has been limited for some time; however, we have recently seen mid-to-long-term (5 to 10 year) mortgages become more obtainable. The collateralized mortgage backed securities, or CMBS, market has been attempting to make a comeback in recent months, but it is much more conservative than it was prior to the recession and the pricing in the market remains volatile. As a result, we will likely not have the same level of access to the CMBS market that we had prior to the recession. Consequently, we are looking to regional banks, insurance companies and other non-bank lenders, and, to a lesser extent, the CMBS market to issue mortgages to finance our real estate activities.
Investment Policies and Policies with Respect to Certain Activities
Types of Investments
Overview
We intend that substantially all of our investments will be generated from the ownership of income-producing real property or, to a much lesser extent, mortgage loans secured by real property. We expect that the vast majority of our investments will be structured as net leases, but if a net lease would have an adverse impact on a potential tenant, or would otherwise be inappropriate for us, we may structure our investment as a mortgage loan. Investments are not restricted to geographical areas, but we expect that most of our investments in real estate will be made within the continental United States. Some of our investments may also be made through joint ventures that would permit us to own interests in large properties without restricting the diversity of our portfolio. Our stockholders are not afforded the opportunity to evaluate the economic merits of our investments or the terms of any dispositions of properties and instead rely on the advice of our Adviser. See “Risk Factors—Our success depends on the performance of our Adviser and if our Adviser makes inadvisable investment or management decisions, our operations could be materially adversely impacted.”
5
We anticipate that we will make substantially all of our investments through our Operating Partnership and Gladstone Commercial Lending. Our Operating Partnership and Gladstone Commercial Lending may acquire interests in real property or mortgage loans in exchange for the issuance of limited partnership units, for cash or through a combination of both. Units issued by our Operating Partnership generally will be redeemable for cash or, at our election, shares of our common stock on a one-for-one basis. However, we may in the future also conduct some of our business and hold some of our interests in real properties or mortgage loans through one or more wholly-owned subsidiaries that are not owned, directly or indirectly, through our Operating Partnership or Gladstone Commercial Lending.
Property Acquisitions and Net Leasing
To date, we have purchased a majority of our properties from owners that have leased their properties to non-affiliated tenants, and while we have engaged in some transactions with tenants who have consummated sale-leaseback transactions, these transactions do not comprise the dominant portion of our portfolio. We expect that some of our sale-leaseback transactions will be in conjunction with acquisitions, recapitalizations or other corporate transactions affecting our tenants. In these transactions, we may act as one of several sources of financing for these transactions by purchasing one or more properties from the tenant and by net leasing it to the tenant or its successor in interest. For a discussion of the risks associated with leasing property to leveraged tenants, see “Risk Factors—Highly leveraged tenants and borrowers may be unable to pay rent or make mortgage payments, which could adversely affect our cash available to make distributions to our stockholders.”
In limited circumstances, we have granted tenants an option to purchase the leased property, and we anticipate granting these options to select tenants in the future. In these cases, we generally seek to fix the option purchase price at the greater of our purchase price for the property and the fair market value of the property at the time the option is exercised.
Our portfolio consists primarily of single-tenant commercial and industrial real property; however, we also own and consider multi-tenant commercial and industrial properties, as well as retail and medical properties. Generally, we lease properties to tenants that our Adviser deems creditworthy under leases that will be full recourse obligations of our tenants or their affiliates. In most cases, our leases will be “triple net leases” that require the tenant to pay all the operating costs, costs of maintenance, insurance and real estate taxes on the property. We seek to obtain lease terms of approximately 10 to 15 years with built-in rental increases.
Investments in Mortgage Loans
Although we expect to make such investments sparingly, we may elect to structure our investment in a particular property as a mortgage loan secured by the property in situations where a standard net lease transaction would have an adverse tax impact on the seller of a property or would otherwise be inappropriate for us. We anticipate that most of our lending transactions will be loans secured by industrial or commercial property. Our Adviser will attempt to structure mortgage loans in a manner that would provide us with current income substantially similar to that which we could expect to receive had the investment been structured as a net lease transaction.
To the extent that we invest in mortgage loans, we will generally originate those loans. However, we may also purchase mortgage loans from banks, CMBS pools, or other lenders if such transactions are consistent with our investment objectives. Our Adviser will service the mortgage loans in our portfolio by monitoring the collection of monthly principal and interest payments on our behalf. There were no mortgage loans outstanding as of December 31, 2011.
6
Underwriting Criteria, Due Diligence Process and Negotiating Lease Provisions
We consider underwriting of the real estate and the tenant for the property (or the borrower in the case of a mortgage loan) to be the most important aspects of making an investment. Evaluating the creditworthiness of the tenant or borrower and its ability to generate sufficient cash flow to make payments to us pursuant to the lease or the mortgage loan is the most important aspect of our underwriting procedures. In analyzing potential acquisitions of properties and leases, our Adviser reviews all aspects of the potential transaction, including tenant and real estate fundamentals, to determine whether potential acquisitions and leases can be structured to satisfy our acquisition criteria. The criteria listed below provide general guideposts that our Adviser may consider when underwriting leases and mortgage loans:
| • | Credit Evaluation. Our Adviser evaluates each potential tenant for its creditworthiness, considering factors such as the rating by a national credit rating agency, if any, management experience, industry position and fundamentals, operating history and capital structure. Currently, 46.0% of our tenants are rated by a national credit rating agency. A prospective tenant that is deemed creditworthy does not necessarily mean that we will consider the tenant’s property to be “investment grade.” Our Adviser seeks tenants that range from small businesses, many of which do not have publicly rated debt, to large public companies. Our Adviser’s investment professionals have substantial experience in locating and financing these types of companies. By leasing properties to these tenants, we believe that we will generally be able to charge rent that is higher than the rent charged to tenants with unleveraged balance sheets and recognized credit, thereby enhancing current return from these properties as compared with properties leased to companies whose credit potential has already been recognized by the market. Furthermore, if a tenant’s credit improves, the value of our lease or investment will likely increase (if all other factors affecting value remain unchanged). In evaluating a possible investment, we believe that the creditworthiness of a prospective tenant is normally a more significant factor than the unleased value of the property itself. While our Adviser selects tenants it believes to be creditworthy, tenants are not required to meet any minimum rating established by an independent credit rating agency. Our Adviser’s standards for determining whether a particular tenant is creditworthy vary in accordance with a variety of factors relating to specific prospective tenants. The creditworthiness of a tenant is determined on a tenant by tenant and case by case basis. Therefore, general standards for creditworthiness cannot be applied. |
| • | Leases with Increasing Rent. Our Adviser seeks to include a clause in each lease that provides for annual rent escalations over the term of the lease. These increases will generally be fixed; however certain leases are tied to increases in indices, such as the consumer price index. |
| • | Diversification. Our Adviser attempts to diversify our portfolio to avoid dependence on any one particular tenant, facility type, geographic location or tenant industry. By diversifying our portfolio, our Adviser intends to reduce the adverse effect of a single under-performing investment or a downturn in any particular industry or geographic region. Total rental income consisted of the following tenant industry classifications as of December 31, 2011 and December 31, 2010: |
| For the year ended December 31, 2011 | For the year ended December 31, 2010 | For the year ended December 31, 2009 | ||||||||||||||||||||||
| (Dollars in Thousands) | (Dollars in Thousands) | (Dollars in Thousands) | ||||||||||||||||||||||
| Industry Classification |
Rental Income | Percentage of Rental Income |
Rental Income | Percentage of Rental Income |
Rental Income | Percentage of Rental Income |
||||||||||||||||||
| Healthcare, Education & Childcare |
$ | 6,467 | 14.7 | % | $ | 6,145 | 14.9 | % | $ | 6,145 | 14.8 | % | ||||||||||||
| Telecommunications |
6,206 | 14.2 | 5,447 | 13.3 | 5,447 | 13.0 | ||||||||||||||||||
| Electronics |
6,046 | 13.9 | 6,165 | 15.0 | 6,165 | 14.9 | ||||||||||||||||||
| Diversified/Conglomerate Manufacturing |
3,664 | 8.4 | 3,665 | 8.9 | 3,664 | 8.8 | ||||||||||||||||||
| Chemicals, Plastics & Rubber |
3,146 | 7.2 | 3,130 | 7.6 | 3,173 | 7.6 | ||||||||||||||||||
| Containers, Packaging & Glass |
2,339 | 5.4 | 2,330 | 5.7 | 2,330 | 5.6 | ||||||||||||||||||
| Personal & Non-Durable Consumer Products |
2,316 | 5.3 | 1,228 | 3.0 | 1,355 | 3.3 | ||||||||||||||||||
| Beverage, Food & Tobacco |
2,271 | 5.2 | 2,189 | 5.3 | 2,189 | 5.3 | ||||||||||||||||||
| Machinery |
2,256 | 5.2 | 2,333 | 5.7 | 2,390 | 5.8 | ||||||||||||||||||
| Buildings and Real Estate |
2,120 | 4.9 | 2,075 | 5.0 | 2,026 | 4.9 | ||||||||||||||||||
| Printing & Publishing |
1,979 | 4.5 | 2,188 | 5.3 | 2,189 | 5.3 | ||||||||||||||||||
| Oil & Gas |
1,271 | 2.9 | 1,283 | 3.1 | 1,138 | 2.7 | ||||||||||||||||||
| Automobile |
1,167 | 2.7 | 1,167 | 2.8 | 1,167 | 2.8 | ||||||||||||||||||
| Diversified/Conglomerate Services |
1,001 | 2.3 | 308 | 0.7 | 308 | 0.8 | ||||||||||||||||||
| Personal, Food & Miscellaneous Services |
649 | 1.5 | 575 | 1.4 | 575 | 1.4 | ||||||||||||||||||
| Home & Office Furnishings |
530 | 1.2 | 530 | 1.3 | 530 | 1.3 | ||||||||||||||||||
| Banking |
204 | 0.5 | — | 0.0 | — | 0.0 | ||||||||||||||||||
| Insurance |
— | 0.0 | 422 | 1.0 | 723 | 1.7 | ||||||||||||||||||
|
|
|
|
|
|
|
|
|
|
|
|
|
|||||||||||||
| $ | 43,632 | 100.0 | % | $ | 41,180 | 100.0 | % | $ | 41,514 | 100.0 | % | |||||||||||||
|
|
|
|
|
|
|
|
|
|
|
|
|
|||||||||||||
7
| • | Property Valuation. The business prospects and the financial strength of the tenant are important aspects of the evaluation of any sale and leaseback of property, or acquisition of property subject to a net lease, particularly a property that is specifically suited to the needs of the tenant. We generally require quarterly unaudited and annual audited financial statements of the tenant in order to continuously monitor the financial performance of the tenant. We evaluate the financial capability of the tenant and its ability to perform per the terms of the lease. We may also examine the available operating results of prospective investment properties to determine whether or not projected rental levels are likely to be met. We then compute the value of the property based on historical and projected operating results. In addition, each property that we propose to purchase is appraised by an independent appraiser. These appraisals may take into consideration, among other things, the terms and conditions of the particular lease transaction and the conditions of the credit markets at the time the purchase is negotiated. We generally limit our property acquisition cost or value to between $3 million and $30 million. |
| • | Properties Important to Tenant Operations. Our Adviser generally seeks to acquire investment properties that are essential or important to the ongoing operations of the prospective tenant. We believe that these investment properties provide better protection in the event a tenant becomes bankrupt, as leases on properties essential or important to the operations of a bankrupt tenant are typically less likely to be rejected in bankruptcy or otherwise terminated. |
| • | Lease Provisions that Enhance and Protect Value. When appropriate, our Adviser attempts to include provisions in our leases that require our consent to specified tenant activity or require the tenant to satisfy specific operating tests. These provisions may include, for example, operational or financial covenants of the tenant, as well as indemnification of us by the tenant against environmental and other contingent liabilities. We believe that these provisions serve to protect our investments from changes in the operating and financial characteristics of a tenant that may impact its ability to satisfy its obligations to us or that could reduce the value of our properties. Our Adviser generally also seeks covenants requiring tenants to receive our consent prior to any change in control of the tenant. |
| • | Credit Enhancement. Our Adviser may also seek to enhance the likelihood of a tenant’s lease obligations being satisfied through a cross-default with other tenant obligations, a letter of credit or a guaranty of lease obligations from each tenant’s corporate parent. We believe that this type of credit enhancement, if obtained, provides us with additional financial security. |
Underwriting of the Real Estate and Due Diligence Process
In addition to underwriting the tenant or borrower, we also underwrite the real estate to be acquired or secured by one of our mortgages. On our behalf, our Adviser performs a due diligence review with respect to each property, such as evaluating the physical condition of a property, zoning and site requirements to ensure the property is in compliance with all zoning regulations as well as an environmental site assessment, in an attempt to determine potential environmental liabilities associated with a property prior to its acquisition, although there can be no assurance that hazardous substances or wastes (as defined by present or future federal or state laws or regulations) will not be discovered on the property after we acquire it. We could incur significant costs related to government regulation and private litigation over environmental matters. See “Risk Factors – We could be exposed to liability and remedial costs related to environmental matters.”
Our Adviser also reviews the structural soundness of the improvements on the property and may engage a structural engineer to review all aspects of the structures in order to determine the longevity of each building on the property. This review normally also includes the components of each building, such as the roof, the electrical wiring, the heating and air-conditioning system, the plumbing, parking lot and various other aspects such as compliance with state and federal building codes.
8
Our Adviser also physically inspects the real estate and surrounding real estate as part of determining the value of the real estate. All of our Adviser’s due diligence is aimed at arriving at a valuation of the real estate under the assumption that it was not rented to the tenant that we are considering. As part of this process, our Adviser may consider one or more of the following items:
| • | The comparable value of similar real estate in the same general area of the prospective property. In this regard, comparable property is difficult to define because each piece of real estate has its own distinct characteristics. But to the extent possible, comparable property in the area that has sold or is for sale will be used to determine if the price to be paid for the property is reasonable. The question of comparable properties’ sale prices is particularly relevant if a property might be sold by us at a later date. |
| • | The comparable real estate rental rates for similar properties in the same area of the prospective property. |
| • | Alternative property uses that may offer higher value. |
| • | The cost of replacing the property if it were to be sold. |
| • | The assessed value as determined by the local real estate taxing authority. |
In addition, our Adviser supplements its valuation with a real estate appraisal in connection with each investment that we consider. When appropriate, our Adviser may engage experts to undertake some or all of the due diligence efforts described above.
Additional Investment Considerations
Terms of Mortgage Loans
Some of the mortgage loans that we may make, purchase or otherwise acquire in the future, in addition to providing for base interest at a fixed or variable rate, may allow us to participate in the economic benefits of any increase in the value of the property securing repayment of the loan as though we were an equity owner of a portion of the property. In addition, it is possible that participation may take other forms where our Adviser deems participation available or otherwise appropriate, provided that such participation does not jeopardize our REIT tax status. The form and extent of our participation, if any, will vary with each transaction depending on factors such as credit support provided by the borrower, the interest rate on our mortgage loans and the anticipated and actual cash flow from the underlying real property. Our mortgage loans may include first mortgage loans, leasehold mortgage loans or conventional mortgage loans without equity enhancements. We have not in the past, nor do we intend in the future to make or invest in sub-prime mortgage loans.
Except as described below, any mortgage loan in our portfolio will generally be secured by real property with demonstrable income-producing potential as well as a security interest in personal or mixed property connected with the real property.
In the event that we make or invest in a mortgage loan, we will generally require a mortgagee’s title insurance policy or commitment as to the lien priority of a mortgage or the condition of title in connection with each mortgage loan. We also may obtain an independent appraisal for underlying real property, that our Adviser may consider when determining whether or not to make or invest in a particular mortgage loan. In making mortgage loans that, when combined with existing loans that are on a parity with or senior to our mortgage loan, exceed 85% of the appraised value of any underlying real property, our Adviser considers additional underwriting criteria such as the net worth of the borrower, the borrower’s credit rating, if any, the anticipated cash flow of the borrower, any additional collateral or other credit enhancements provided by the borrower or its affiliates and other factors our Adviser deems appropriate. Where we think it is
9
appropriate, we may make mortgage loans that are subordinated to a first mortgage on a property. For example, if the property is subject to an economic development loan as a first mortgage at a particularly low interest rate, we may make a second mortgage loan on the property. However, we will not make a second mortgage loan on any property that we would not consider owning, subject to the existing senior financing, and leasing to the tenant.
From time to time, we may purchase mortgage loans, including loans being sold at a discount, from banks and other financial institutions if the subject property otherwise satisfies our underwriting criteria.
Other Investments
Under IRS REIT rules, we may invest up to an aggregate of 10% of our net equity in unimproved or non-income-producing real property and in “equity interests.” “Equity interests” are defined generally to mean stock, warrants or other rights to purchase the stock of, or other equity interests in, a tenant of a property, an entity to which we lend money or a parent or controlling person of a borrower or tenant, and we will not acquire equity interests in any entity other than in connection with a lease or mortgage loan transaction. We anticipate that equity interests will not exceed 5% of our net equity in the aggregate, and we will not make any such investment in equity interests if such investment would adversely affect our qualification as a REIT for tax purposes. To the extent that we hold equity interests in tenants or borrowers, we anticipate that they will generally be “restricted securities” as defined in Rule 144 under the Securities Act. Under this rule, we may be prohibited from reselling the equity securities without limitation until we have fully paid for and held any such securities for one year. The issuer of equity interests, in which we invest, may never register these interests under the federal securities laws, since any decision of an issuer to register its securities may depend on any number of factors, including the success of its operations.
We will generally invest in unimproved or non-income-producing property only when our Adviser believes that such property will appreciate in value or will increase the value of an adjoining or neighboring property that we own.
We might use taxable REIT subsidiaries to acquire or hold property, including equity interests that may not be deemed to be REIT-qualified assets. Taxable REIT subsidiaries are taxed as ordinary corporations and any taxes paid by such entity will reduce cash available to us for payment of distributions to our stockholders.
Joint Ventures
In the future, we may also enter into joint ventures, partnerships and other mutual arrangements with real estate developers, property owners and others for the purpose of obtaining an equity interest in a property in accordance with our investment policies. Joint venture investments could permit us to own interests in large properties without unduly restricting the diversity of our portfolio. We will not enter into a joint venture to make an investment that we would not otherwise purchase on our own under our existing investment policies.
Use of Leverage
Non-recourse Financing
We use long-term mortgage borrowings as a financing mechanism in amounts that we believe will maximize the return to our stockholders. Currently, a majority of our long-term mortgage borrowings are structured as non-recourse to us, and we intend to structure any medium-term mortgages in the same manner, with limited exceptions that would trigger recourse to us only upon the occurrence of certain fraud, misconduct, environmental or bankruptcy events. The use of non-recourse financing allows us to limit our exposure to the amount of equity invested in the properties pledged as collateral for our borrowings. Non-recourse financing generally restricts a lender’s claim on the assets of the borrower, and as a result, the
10
lender generally may look only to the property securing the debt for satisfaction of the debt. We believe that this financing strategy, to the extent available, protects our other assets. However, we can provide no assurance that non-recourse financing will be available on terms acceptable to us, or at all, and there may be circumstances where lenders have recourse to our other assets. There is no limitation on the amount we may borrow against any single investment property. Of the $286.2 million in long-term mortgages outstanding, only $2.0 million is recourse to the Company.
We believe that, by operating on a leveraged basis, we will have more funds available and, therefore, will make more investments than would otherwise be possible if we operated on a non-leveraged basis. We believe that this creates a more diversified portfolio and maximizes potential returns to our stockholders. We may refinance properties during the term of a loan when we believe it is advantageous.
Recourse Financing
Borrowings under our $75.0 million Line of Credit, which is secured by those properties pledged to the borrowing base under the Line of Credit are considered recourse financing, which means that our lenders have a claim against our assets. We intend to use our existing Line of Credit as a warehouse Line of Credit whereby we borrow on a short-term basis until long-term financing can be arranged.
Other Investment Policies
Working Capital Reserves
We may establish a working capital reserve, which we would anticipate to be sufficient to satisfy our liquidity requirements. Our liquidity could be adversely affected by unanticipated costs, greater-than-anticipated operating expenses or cash shortfalls in funding our distributions to stockholders. To the extent that the working capital reserve is insufficient to satisfy our cash requirements, additional funds may be produced from cash generated from operations or through short-term borrowings. In addition, subject to limitations described in this Form 10-K, we may incur indebtedness in connection with:
| • | the acquisition of any property; |
| • | the refinancing of the debt upon any property; or |
| • | the leveraging of any previously unleveraged property. |
For additional information regarding our borrowing strategy, see “- Use of Leverage.”
Holding Period for and Sale of Investments; Reinvestment of Sale Proceeds
We intend to hold each property we acquire for an extended period. However, circumstances might arise which could result in the early sale of some properties if, in the judgment of our Adviser, the sale of the property is in the best interests of us and our stockholders.
The determination of whether a particular property should be sold or otherwise disposed of will be made after consideration of all relevant factors, including prevailing economic conditions, with a view to achieving maximum capital appreciation. The selling price of a property which is subject to a net lease will be determined in large part by the amount of rent payable under the lease, the remaining term of the lease, and the creditworthiness of the tenant. In connection with our sales of properties, we may lend the purchaser all or a portion of the purchase price. In these instances, our taxable income may exceed the cash received by us in connection with any such sale, which could cause us to delay required distributions to our stockholders.
11
The terms of any sale will be dictated by custom in the area in which the property being sold is located and the then-prevailing economic conditions. A decision to provide financing to any purchaser would be made only after an investigation into and consideration of the same factors regarding the purchaser, such as creditworthiness and likelihood of future financial stability, as are undertaken when we consider a net lease or mortgage loan transaction.
We may continually reinvest the proceeds of property sales in investments that either we or our Adviser believe will satisfy our investment policies.
Investment Limitations
There are numerous limitations on the manner in which we may invest our funds, which unless otherwise noted below, may be amended or waived by our Board of Directors at anytime. Our Board of Directors has adopted a policy that we will not:
| • | invest in real property owned by our Adviser, any of its affiliates or any business in which our Adviser or any of its subsidiaries have invested except that we may lease property to existing and prospective portfolio companies of current or future affiliates, such as Gladstone Capital Corporation, Gladstone Investment Corporation and entities advised by our Adviser, so long as that entity does not control the portfolio company and the transaction is approved by both companies’ Board of Directors (this policy may not be changed without the approval of our stockholders); |
| • | invest in commodities or commodity futures contracts, with this limitation not being applicable to futures contracts when used solely for the purpose of hedging in connection with our ordinary business of investing in properties and making mortgage loans; |
| • | invest in contracts for the sale of real estate unless the contract is appropriately recorded in the chain of title; |
| • | invest in any individual property with a cost in excess of 20% of our total assets at the time of investment; |
| • | make investments in unimproved property or indebtedness secured by a deed of trust or mortgage loans on unimproved property in excess of 10% of our total assets. “Unimproved real property” is property which has the following three characteristics: |
| • | the property was not acquired for the purpose of producing rental or other operating income; |
| • | no development or construction is in process on the property; and |
| • | no development or construction on the property is planned in good faith to commence on the property within one year of acquisition; |
| • | issue equity securities on a deferred payment basis or other similar arrangement; |
| • | issue debt securities in the absence of adequate cash flow to cover debt service; |
| • | issue “redeemable securities” as defined in Section 2(a)(32) of the Investment Company Act of 1940; |
| • | grant warrants or options to purchase shares of our stock to our Adviser or its affiliates; |
| • | engage in trading, as compared with investment activities, or engage in the business of underwriting, or the agency distribution of, securities issued by other persons; |
12
| • | acquire securities in any company holding investments or engaging in activities prohibited in the foregoing clauses; or |
| • | make or invest in mortgage loans that are subordinate to any mortgage or equity interest of any of our affiliates. |
Conflict of Interest Policy
We have adopted policies to reduce potential conflicts of interest. In addition, our directors are subject to certain provisions of Maryland law that are designed to minimize conflicts. However, we cannot assure you that these policies or provisions of law will reduce or eliminate the influence of these conflicts.
Under our current conflict of interest policy, without the approval of a majority of our independent directors, we will not:
| • | acquire from or sell to any of our officers, directors or our Adviser’s employees, or any entity in which any of our officers, directors or employees has an interest of more than 5%, any assets or other property; |
| • | borrow from any of our directors, officers or employees, or any entity, in which any of our officers, directors or employees has an interest of more than 5% or; |
| • | engage in any other transaction with any of our directors, officers or employees, or any entity in which any of our directors, officers or employees has an interest of more than 5% (except that our Adviser may lease office space in a building that we own, provided that the rental rate under the lease is determined by our independent directors to be at a fair market rate). |
Our policy also prohibits us from purchasing any real property owned by or co-investing with our Adviser, any of its affiliates or any business in which our Adviser or any of its subsidiaries have invested, except that we may lease property to existing and prospective portfolio companies of current or future affiliates, such as Gladstone Capital Corporation or Gladstone Investment Corporation and other entities advised by our Adviser, so long as that entity does not control the portfolio company and the transaction is approved by both companies’ Board of Directors. If we decide to change this policy on co-investments with our Adviser or its affiliates, we will seek our stockholders’ approval.
Future Revisions in Policies and Strategies
Our independent directors periodically review our investment policies to evaluate whether they are in the best interests of us and our stockholders. Our investment procedures, objectives and policies may vary as new investment techniques are developed or as regulatory requirements change, and except as otherwise provided in our charter or bylaws, may be altered by a majority of our directors (including a majority of our independent directors) without the approval of our stockholders, to the extent that our Board of Directors determines that such modification is in the best interest of our stockholders. Among other factors, developments in the market which affect the policies and strategies described in this report or which change our assessment of the market may cause our Board of Directors to revise our investment policies and strategies.
Our Adviser and Administrator
Our business is managed by Gladstone Management Corporation, or our Adviser. The officers, directors and employees of our Adviser have significant experience in making investments in and lending to businesses of all sizes, including investing in real estate and making mortgage loans. We have entered into the Advisory Agreement (as defined below) with our Adviser under which our Adviser is responsible for managing our assets and liabilities, for operating our business on a day-to-day basis and for identifying,
13
evaluating, negotiating and consummating investment transactions consistent with our investment policies as determined by our Board of Directors from time to time. Gladstone Administrations, LLC, or our Administrator, employs our chief financial officer, chief compliance officer, internal counsel, treasurer, investor relations department and their respective staffs.
David Gladstone, our chairman and chief executive officer, is also the chairman, chief executive officer and the controlling stockholder of our Adviser. Terry Lee Brubaker, our vice chairman, secretary and chief operating officer and a member of our Board of Directors, also serves in the same capacities for our Adviser. George Stelljes III, our president and chief investment officer and a member of our Board of Directors, also serves in the same capacities for our Adviser.
Our Adviser maintains an investment committee that approves each of our investments. This investment committee is comprised of Messrs. Gladstone, Brubaker and Stelljes. We believe that our Adviser’s investment committee review process gives us a unique competitive advantage over other REITs because of the substantial experience and perspective that the members possess in evaluating the blend of corporate credit, real estate and lease terms that combine to provide an acceptable risk for our investments.
Our Adviser’s Board of Directors has empowered its investment committee to authorize and approve our investments, subject to the terms of the Advisory Agreement. Before we acquire any property, the transaction is reviewed by our Adviser’s investment committee to ensure that, in its view, the proposed transaction satisfies our investment criteria and is within our investment policies. Approval by our Adviser’s investment committee is generally the final step in the property acquisition approval process, although the separate approval of our Board of Directors is required in certain circumstances described below. For further detail on this process, please see “Investment Policies and Policies with Respect to Certain Activities - Underwriting Criteria, Due Diligence Process and Negotiating Lease Provisions.”
Our Adviser is headquartered in McLean, Virginia, a suburb of Washington D.C., and also has offices in New York, Connecticut, California and Illinois.
Investment Advisory and Administration Agreements
Many of the services performed by our Adviser and Administrator in managing our day-to-day activities are summarized below. This summary is provided to illustrate the material functions which our Adviser and Administrator perform for us pursuant to the terms of the Advisory and Administration Agreements (as defined below), respectively, but it is not intended to include all of the services which may be provided to us by third parties.
We have an advisory agreement with our Adviser, or the Advisory Agreement, and an administration agreement with our Administrator, or the Administration Agreement.
Investment Advisory Agreement
Under the terms of the Advisory Agreement, we are responsible for all expenses incurred for our direct benefit. Examples of these expenses include legal, accounting, interest on short-term debt and mortgages, tax preparation, directors’ and officers’ insurance, stock transfer services, stockholder-related fees, consulting and related fees. In addition, we are also responsible for all fees charged by third parties that are directly related to our business, which may include real estate brokerage fees, mortgage placement fees, lease-up fees and transaction structuring fees (although we may be able to pass some or all of such fees on to our tenants and borrowers).
During the years ended December 31, 2011, 2010 and 2009, none of these third party expenses were incurred by us directly. The actual amount of such fees that we incur in the future will depend largely upon the aggregate costs of the properties that we acquire, the aggregate amount of mortgage loans that we make and the extent to which we are able to pass on such fees to our tenants and borrowers pursuant to the terms of the agreements. Accordingly, the amount of these fees that we will pay in the future is not determinable at this time.
14
Management Services and Fees under the Advisory Agreement
The Advisory Agreement provides for an annual base management fee equal to 2.0% of our total stockholders’ equity, less the recorded value of any preferred stock, and an incentive fee based on FFO. Our Adviser does not charge acquisition or disposition fees when we acquire or dispose of properties as is common in other externally managed REITs. Furthermore, there are no fees charged when our Adviser secures long or short term credit or arranges mortgage loans on our properties; however, our Adviser may earn fee income from our borrowers or tenants or other sources. This fee income earned by our Adviser, or a portion thereof, may, at the sole discretion of the Board of Directors, be credited against our base management fee as a rebate to the base management fee.
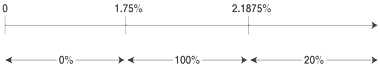
For purposes of calculating the incentive fee, FFO includes any realized capital gains and capital losses, less any distributions paid on preferred stock and senior common stock, but FFO does not include any unrealized capital gains or losses. The incentive fee would reward our Adviser if our quarterly FFO, before giving effect to any incentive fee, or pre-incentive fee FFO, exceeds 1.75%, or the hurdle rate, of total stockholders’ equity, less the recorded value of any preferred stock. We pay our Adviser an incentive fee with respect to our pre-incentive fee FFO in each calendar quarter as follows:
| • | no incentive fee in any calendar quarter in which our pre-incentive fee FFO does not exceed the hurdle rate of 1.75% (7% annualized); |
| • | 100% of the amount of the pre-incentive fee FFO that exceeds the hurdle rate, but is less than 2.1875% in any calendar quarter (8.75% annualized); and |
| • | 20% of the amount of our pre-incentive fee FFO that exceeds 2.1875% in any calendar quarter (8.75% annualized). |
Quarterly Incentive Fee Based on FFO
Pre-incentive fee FFO
(expressed as a percentage of total common stockholders’ equity)
Percentage of pre-incentive fee FFO allocated to incentive fee
The incentive fee may be reduced because of our Line of Credit covenant which limits distributions to our stockholders to 95% of FFO less those acquisition-related costs that are required to be expensed under Accounting Standards Codification, or ASC, 805, Business Combinations.
Administration Agreement
Under the terms of the Administration Agreement, we pay separately for our allocable portion of our Administrator’s overhead expenses in performing its obligations to us including, but not limited to, rent, and our allocable portion of the salaries and benefits expenses of our Administrator’s employees, including, but not limited to, our chief financial officer, chief compliance officer, internal counsel, treasurer, investor relations department and their respective staffs. Our allocable portion of expenses is derived by multiplying our Administrator’s total expenses by the percentage of our total assets at the beginning of each quarter in comparison to the total assets of all companies managed by our Adviser under similar agreements.
15
Adviser Duties and Authority under the Advisory Agreement
Under the terms of the Advisory Agreement, our Adviser is required to use its best efforts to present to us investment opportunities consistent with our investment policies and objectives as adopted by our Board of Directors. In performing its duties, our Adviser, either directly or indirectly by engaging an affiliate:
| • | finds, evaluates, and enters into contracts to purchase real estate and make mortgage loans on our behalf in compliance with our investment procedures, objectives and policies, subject to approval of our Board of Directors, where required; |
| • | provides advice to us and acts on our behalf with respect to the negotiation, acquisition, financing, refinancing, holding, leasing and disposition of real estate investments; |
| • | takes the actions and obtains the services necessary to effect the negotiation, acquisition, financing, refinancing, holding, leasing and disposition of real estate investments; and |
| • | provides day-to-day management of our business activities and other administrative services for us as requested by our Board of Directors. |
Our Board of Directors has authorized our Adviser to make investments in any property on our behalf without the prior approval of our board if the following conditions are satisfied:
| • | our Adviser has obtained an independent appraisal for the property indicating that the total cost of the property does not exceed its appraised value; and |
| • | our Adviser has concluded that the property, in conjunction with our other investments and proposed investments, is reasonably expected to fulfill our investment objectives and policies as established by our Board of Directors then in effect. |
The actual terms and conditions of transactions involving investments in properties and mortgage loans are determined in the sole discretion of our Adviser, subject at all times to compliance with the foregoing requirements. Some types of transactions, however, require the prior approval of our Board of Directors, including a majority of our independent directors, including the following:
| • | loans not secured or otherwise supported by real property; |
| • | any acquisition or mortgage loan which at the time of investment would have a cost exceeding 20% of our total assets; |
| • | transactions that involve conflicts of interest with our Adviser (other than reimbursement of expenses in accordance with the Advisory Agreement); and |
| • | the lease of assets to our Adviser, its affiliates or any of our officers or directors. |
Our Adviser and Administrator also engage in other business ventures and, as a result, their resources are not dedicated exclusively to our business. For example, our Adviser and Administrator also serve as the external adviser to Gladstone Capital Corporation and Gladstone Investment Corporation, both publicly traded business development companies affiliated with us, and Gladstone Land Corporation, a private agricultural real estate company. However, under the Advisory Agreement, our Adviser is required to devote sufficient resources to the administration of our affairs to discharge its obligations under the agreement. The Advisory Agreement is not assignable or transferable by either us or our Adviser without
16
the consent of the other party, except that our Adviser may assign the Advisory Agreement to an affiliate for whom our Adviser agrees to guarantee its obligations to us. Either we or our Adviser may assign or transfer the Advisory Agreement to a successor entity.
Dealer Manager Agreement
In connection with the offering of our Senior Common Stock we entered into a Dealer Manager Agreement, dated March 25, 2011 (the “Dealer Manager Agreement”), with Gladstone Securities, LLC (the “Dealer Manager”), pursuant to which the Dealer Manager agreed to act as our exclusive dealer manager in connection with the offering. The Dealer Manager is an affiliate of us, as its parent company is controlled by Mr. David Gladstone, our Chairman and Chief Executive Officer. Pursuant to the terms of the Dealer Manager Agreement, the Dealer Manager is entitled to receive a sales commission in the amount of 7.0% of the gross proceeds of the shares of senior common stock sold, plus a dealer manager fee in the amount of 3.0% of the gross proceeds of the shares of Senior Common Stock sold. In addition, we have agreed to indemnify the Dealer Manager against various liabilities, including certain liabilities arising under the federal securities laws. We made $5 of payments during 2011 to the Dealer Manager pursuant to this agreement.
Employees
We do not currently have any employees and do not expect to have any employees in the foreseeable future. Currently, services necessary for our business are provided by individuals who are employees of our Adviser and our Administrator pursuant to the terms of the Advisory Agreement and the Administration Agreement, respectively. Each of our executive officers is an employee or officer, or both, of our Adviser or our Administrator. No employee of our Adviser or our Administrator will dedicate all of his or her time to us. However, we expect that 15-20 full time employees of our Adviser or our Administrator will spend substantial time on our matters during calendar year 2012. To the extent that we acquire more investments, we anticipate that the number of employees of our Adviser and our Administrator who devote time to our matters will increase.
As of December 31, 2011, our Adviser and our Administrator collectively had 53 full-time employees. A breakdown of these employees is summarized by functional area in the table below:
| Number of Individuals |
Functional Area | |
| 10 |
Executive Management | |
| 32 |
Investment Management, Portfolio Management and Due Diligence | |
| 11 |
Administration, Accounting, Compliance, Human Resources, Legal and Treasury | |
Competition
We compete with a number of other real estate companies and traditional mortgage lenders, many of whom have greater marketing and financial resources than we do. Principal factors of competition in our primary business of investing in and owning leased industrial and commercial real property are the quality of properties, leasing terms, attractiveness and convenience of location. Additionally, our ability to compete depends upon, among other factors, trends of the national and local economies, investment alternatives, financial condition and operating results of current and prospective tenants and borrowers, availability and cost of capital, taxes and governmental regulations.
17
Environmental Matters
As a current and prior owner of real estate, we are subject to various federal, state and local environmental laws, regulations and ordinances and also could be liable to third parties resulting from environmental contamination or noncompliance at our properties. Environmental laws often impose liability without regard to whether the owner or operator knew of, or was responsible for, the presence of the contaminants, and the costs of any required investigation or cleanup of these substances can be substantial. The liability is generally not limited under such laws and could exceed the property’s value and the aggregate assets of the liable party. The presence of contamination or the failure to remediate contamination at our properties also may expose us to third-party liability for personal injury or property damage, or adversely affect our ability to sell, lease or develop the real property or to borrow using the real property as collateral. These and other risks related to environmental matters are described in more detail in “Item 1A. – Risk Factors” below.
Available Information
Copies of our annual report on Form 10-K, quarterly reports on Form 10-Q, current reports on Form 8-K, proxy statements and amendments, if any, to those reports filed pursuant to Section 13(a) or 15(d) of the Securities Exchange Act are available free of charge through our website at www.GladstoneCommercial.com. A request for any of these reports may also be submitted to us by sending a written request addressed to Investor Relations Manager, Gladstone Commercial Corporation, 1521 Westbranch Drive, Suite 200, McLean, VA 22102, or by calling our toll-free investor relations line at 1-866-366-5745. The public may read and copy materials that we file with the Securities and Exchange Commission, or the SEC, at the SEC’s Public Reference Room at 100 F Street, NE, Washington, DC 20549. Information on the operation of the Public Reference Room may be obtained by calling the SEC at 1-800-SEC-0330. The SEC also maintains a website that contains reports, proxy and information statements, and other information regarding issuers that file electronically with the SEC at www.sec.gov.
18
An investment in our securities involves a number of significant risks and other factors relating to our structure and investment objectives. As a result, we cannot assure you that we will achieve our investment objectives. You should consider carefully the following information before making an investment in our securities.
Risks related to the economy
The current state of the economy and the capital markets increases the possibility of adverse effects on our financial position, results of operations and the market price of our securities.
Over the last four years, the United States (the “U.S.”) capital markets have experienced significant price volatility and liquidity disruptions, which have caused market prices of many stocks and debt securities to fluctuate substantially and the spreads on prospective debt financings to widen considerably. We believe that it will be a few more years before the U.S. fully recovers from the recession. These circumstances have materially impacted liquidity in the financial markets, making terms for certain financings less attractive, and in certain cases have resulted in the lack of availability of certain types of financing. Continued uncertainty in the stock and credit markets may negatively impact our ability to access additional financing at reasonable terms, which may negatively affect our ability to make acquisitions. These disruptions in the financial markets also may have a material adverse effect on the market value of our common and preferred stock and the lease rates we can charge for our properties, as well as other unknown adverse effects on us or the economy in general. In addition, the continued challenging economic conditions could still materially and adversely impact the financial condition of one or more of our tenants and, therefore, could increase the likelihood that a tenant may declare bankruptcy or default upon its payment obligations arising under a related lease.
The recent downgrade of the U.S. credit rating and the economic crisis in Europe could negatively impact our liquidity, financial condition and earnings.
Recent U.S. debt ceiling and budget deficit concerns, together with signs of deteriorating sovereign debt conditions in Europe, have increased the possibility of additional credit-rating downgrades and economic slowdowns. Although U.S. lawmakers passed legislation to raise the federal debt ceiling, Standard & Poor’s Ratings Services lowered its long-term sovereign credit rating on the U.S. from “AAA” to “AA+” in August 2011. The impact of this or any further downgrades to the U.S. government’s sovereign credit rating, or its perceived creditworthiness, and the impact of the current crisis in Europe with respect to the ability of certain European Union countries to continue to service their sovereign debt obligations is inherently unpredictable and could adversely affect the U.S. and global financial markets and economic conditions. There can be no assurance that governmental or other measures to aid economic recovery will be effective. These developments and the government’s credit concerns in general, could cause interest rates and borrowing costs to rise, which may negatively impact our ability to access the debt markets on favorable terms. In addition, the decreased credit rating could create broader financial turmoil and uncertainty, which may weigh heavily on our stock price. Continued adverse economic conditions could have a material adverse effect on one or more of our tenants, or our business, financial condition and results of operations.
Inflation may adversely affect our financial condition and results of operations.
Although inflation has not materially impacted our results of operations in the past, increased inflation could have a more pronounced negative impact on our results of operations. During times when inflation is greater than increases in rent, as provided for in our leases, rent increases may not keep up with the rate of inflation. Likewise, even though triple net leases reduce our exposure to rising property expenses due to inflation, substantial inflationary pressures and increased costs may have an adverse impact on our tenants if increases in their operating expenses exceed increases in revenue, which may adversely affect the tenants’ ability to pay rent.
19
Risks related to our financing
Our Line of Credit contains various covenants which, if not complied with, could accelerate our repayment obligations, thereby materially and adversely affecting our liquidity, financial condition, results of operations and ability to pay distributions to stockholders.
The agreement governing our Line of Credit requires us to comply with certain financial and operational covenants. These covenants require us to, among other things, maintain certain financial ratios, including fixed charge coverage, debt service coverage and a minimum net worth. We are also required to limit our distributions to stockholders to 95% of our FFO, and continued compliance with this covenant may require us to limit our distributions to stockholders. As of December 31, 2011, we were in compliance with these covenants. However, our continued compliance with these covenants depends on many factors, and could be impacted by current or future economic conditions, and thus there are no assurances that we will continue to comply with these covenants. In addition, we have $45.2 million of mortgage debt maturing in October 2013. Under the terms of the Line of Credit, we must refinance, extend or have enough cash on hand, including availability under our Line of Credit, as of April 2013 or we would be considered in default. Failure to comply with these covenants would result in a default which, if we were unable to obtain a waiver from the lenders, could accelerate our repayment obligations under the Line of Credit and thereby have a material adverse impact on our liquidity, financial condition, results of operations and ability to pay distributions to stockholders.
Our business strategy relies heavily on external financing, which may expose us to risks associated with leverage such as restrictions on additional borrowing and payment of distributions to stockholders, risks associated with balloon payments, and risk of loss of our equity upon foreclosure.
We use leverage so that we may make more investments than would otherwise be possible in order to maximize potential returns to stockholders. If the income generated by our properties and other assets fails to cover our debt service, we could be forced to reduce or eliminate distributions to our stockholders and may experience losses.
Our ability to achieve our investment objectives will be affected by our ability to borrow money in sufficient amounts and on favorable terms. We expect that we will borrow money that will be secured by our properties and that these financing arrangements will contain customary covenants such as those that limit our ability, without the prior consent of the lender, to further mortgage the applicable property or to discontinue insurance coverage. Accordingly, we may be unable to obtain the degree of leverage we believe to be optimal, which may cause us to have less cash for distribution to stockholders than we would have with an optimal amount of leverage. Our use of leverage could also make us more vulnerable to a downturn in our business or the economy, as it may become difficult to meet our debt service obligations if our cash flows are reduced due to tenant defaults. There is also a risk that a significant increase in the ratio of our indebtedness to the measures of asset value used by financial analysts may have an adverse effect on the market price of our securities.
Some of our debt financing arrangements may require us to make lump-sum or “balloon” payments at maturity. Our ability to make a balloon payment at maturity is uncertain and may depend upon our ability to obtain additional financing or to sell the financed property. At the time the balloon payment is due, we may not be able to refinance the balloon payment on terms as favorable as the original loan or sell the property at a price sufficient to make the balloon payment, which could adversely affect the amount of distributions to our stockholders.
We intend to acquire additional properties by using our Line of Credit and by continuing to seek long-term financing, where we will borrow all or a portion of the purchase price of a potential acquisition and securing the loan with a mortgage on some or all of our existing real property. The market for long-term mortgages has been limited for some time; however, we have recently seen mid-to-long-term (5 to 10 year) mortgages become more obtainable. The CMBS market has been attempting to make a comeback in recent months, but it is much more conservative than it was prior to the recession and the pricing in the market
20
remains volatile. As a result, we will likely not have the same level of access to the CMBS market that we had prior to the recession. Consequently, we are looking to regional banks, insurance companies and other non-bank lenders, and, to a lesser extent, the CMBS market to issue mortgages to finance our real estate activities. As of December 31, 2011 we have obtained approximately $285.0 million in long-term financing, which we have used to acquire additional properties. If we are unable to make our debt payments as required, a lender could foreclose on the property securing its loan. This could cause us to lose part or all of our investment in such property which in turn could cause the value of our securities or the amount of distributions to our stockholders to be reduced.
A change in the value of our assets could cause us to experience a cash shortfall, be in default of our loan covenants, lose management control or incur a charge for the impairment of assets.
We borrow on a secured basis under the Line of Credit. A significant reduction in value of the assets secured as collateral could require us to post additional assets or pay down the balance of the Line of Credit. Although we believe that we have significant excess collateral and capacity, future asset values are uncertain. If we were unable to meet a request to add collateral to the Line of Credit, this inability could have a material adverse affect on our liquidity and our ability to meet our loan covenants. We may determine that the value of an individual asset, or group of assets, was impaired, and that we may need to record a charge to write-down the value of the asset to reflect its current estimated value based upon its intended use.
Interest rate changes may adversely affect our results of operations.
We may experience interest rate volatility in connection with mortgage loans on our properties or other variable-rate debt that we may obtain from time to time. Certain of our leases contain escalations based on market interest rates and the interest rate on our existing Line of Credit is variable. Although we seek to mitigate this risk by structuring such provisions to contain a minimum interest rate or escalation rate, as applicable, these features do not eliminate this risk. We are also exposed to the effects of interest rate changes as a result of holding cash and cash equivalents in short-term, interest-bearing investments. We have not entered into any derivative contracts to attempt to further manage our exposure to interest rate fluctuations. A significant change in interest rates could have an adverse impact on our results of operations.
Risks related to the real estate industry
We are subject to certain risks associated with real estate ownership and lending which could reduce the value of our investments.
Our investments include net leased industrial, commercial and retail property. Our performance, and the value of our investments, is subject to risks inherent to the ownership and operation of these types of properties, including:
| • | changes in the general economic climate; |
| • | changes in local conditions such as an oversupply of space or reduction in demand for real estate; |
| • | changes in interest rates and the availability of financing; |
| • | competition from other available space; and |
| • | changes in laws and governmental regulations, including those governing real estate usage, zoning and taxes. |
The debt obligations of our tenants are dependent upon certain factors, which neither we nor our tenants or borrowers control, such as national, local and regional business and economic conditions, government economic policies, and the level of interest rates. As discussed in “Risks related to the economy” above, the credit markets have tightened resulting in a significant contraction in available liquidity. Accordingly, the
21
credit market constraints and recession may increase the operating expenses of our tenants and decrease their ability to make lease payments, and thereby adversely affect our liquidity, financial condition, results of operations and ability to pay distributions to our stockholders.
Competition for the acquisition of real estate may impede our ability to make acquisitions or increase the cost of these acquisitions.
We compete for the acquisition of properties with many other entities engaged in real estate investment activities, including financial institutions, institutional pension funds, other REITs, other public and private real estate companies and private real estate investors. These competitors may prevent us from acquiring desirable properties or may cause an increase in the price we must pay for real estate. Our competitors may have greater resources than we do, and may be willing to pay more for certain assets or may have a more compatible operating philosophy with our acquisition targets. In particular, larger REITs may enjoy significant competitive advantages that result from, among other things, a lower cost of capital and enhanced operating efficiencies. Our competitors may also adopt transaction structures similar to ours, which would decrease our competitive advantage in offering flexible transaction terms. In addition, the number of entities and the amount of funds competing for suitable investment properties may increase, resulting in increased demand and increased prices paid for these properties.
Our ownership of properties through ground leases exposes us to risks which are different than those resulting from our ownership of fee title to other properties.
We have acquired an interest in certain of our properties by acquiring a leasehold interest in the land underlying the property, and we may acquire additional properties in the future that are subject to similar ground leases. In this situation, we have no economic interest in the land underlying the property and do not control this land. Because we do not control the underlying land, this type of ownership interest poses potential risks for our business because (i) if the ground lease terminates for any reason, we will lose our interest in the property, including any investment that we made in the property, (ii) if our tenant defaults under the previously existing lease, we will continue to be obligated to meet the terms and conditions of the ground lease without the annual amount of ground lease payments reimbursable to us by the tenant, and (iii) if the third party owning the land under the ground lease disrupts our use either permanently or for a significant period of time, then the value of our assets could be impaired and our results of operations could be adversely affected.
Risks related to our tenants, borrowers and properties
Highly leveraged tenants and borrowers may be unable to pay rent or make mortgage payments, which could adversely affect our cash available to make distributions to our stockholders.
Some of our tenants and borrowers may have recently been either restructured using leverage, or acquired in a leveraged transaction. Tenants and borrowers that are subject to significant debt obligations may be unable to make their rent or mortgage payments if there are adverse changes to their businesses or because of the impact of the recession discussed in “Risks related to the economy.” Tenants that have experienced leveraged restructurings or acquisitions will generally have substantially greater debt and substantially lower net worth than they had prior to the leveraged transaction. In addition, the payment of rent and debt service may reduce the working capital available to leveraged entities and prevent them from devoting the resources necessary to remain competitive in their industries.
In situations where management of the tenant or borrower will change after a transaction, it may be difficult for our Adviser to determine with certainty the likelihood of the tenant’s or borrower’s business success and of its ability to pay rent or make mortgage payments throughout the lease or loan term. These companies generally are more vulnerable to adverse economic and business conditions, and increases in interest rates.
22
Leveraged tenants and borrowers are more susceptible to bankruptcy than unleveraged tenants. Bankruptcy of a tenant or borrower could cause:
| • | the loss of lease or mortgage payments to us; |
| • | an increase in the costs we incur to carry the property occupied by such tenant; |
| • | a reduction in the value of our securities; or |
| • | a decrease in distributions to our stockholders. |
Under bankruptcy law, a tenant who is the subject of bankruptcy proceedings has the option of continuing or terminating any unexpired lease. If a bankrupt tenant terminates a lease with us, any claim we might have for breach of the lease (excluding a claim against collateral securing the claim) will be treated as a general unsecured claim. Our claim would likely be capped at the amount the tenant owed us for unpaid rent prior to the bankruptcy unrelated to the termination, plus the greater of one year’s lease payments or 15% of the remaining lease payments payable under the lease (but no more than three years’ lease payments). In addition, due to the long-term nature of our leases and terms providing for the repurchase of a property by the tenant, a bankruptcy court could re-characterize a net lease transaction as a secured lending transaction. If that were to occur, we would not be treated as the owner of the property, but might have additional rights as a secured creditor.
Net leases may not result in fair market lease rates over time.
We expect a large portion of our rental income to come from net leases and net leases frequently provide the tenant greater discretion in using the leased property than ordinary property leases, such as the right to sublease the property, subject to our approval, to make alterations in the leased premises and to terminate the lease prior to its expiration under specified circumstances. Further, net leases are typically for longer lease terms and, thus, there is an increased risk that contractual rental increases in future years will fail to result in fair market rental rates during those years. As a result, our income and distributions to our stockholders could be lower than they would otherwise be if we did not engage in net leases.
Many of our tenants are small and medium size businesses, which exposes us to additional risks unique to these entities.
Leasing real property or making mortgage loans to small and medium-sized businesses exposes us to a number of unique risks related to these entities, including the following:
| • | Small and medium-sized businesses may have limited financial resources and may not be able to make their lease or mortgage payments on a timely basis, or at all. A small or medium-sized tenant or borrower may be more likely to have difficulty making its lease or mortgage payments when it experiences adverse events, such as the failure to meet its business plan, a downturn in its industry or negative economic conditions. In addition, because of the lack of available credit in the current marketplace, as discussed further in “Risks related to the economy” above, our tenants might not be able to obtain the financing necessary to fund their working capital, which could hinder their ability to make their lease or mortgage payment on a timely basis, or at all. |
| • | Small and medium-sized businesses typically have narrower product lines and smaller market shares than large businesses. Because our target tenants and borrowers are typically smaller businesses that may have narrower product lines and smaller market share, they will tend to be more vulnerable to competitors’ actions and market conditions, as well as general economic downturns. In addition, our target tenants and borrowers may face intense competition, including competition from companies with greater financial resources, more extensive development, manufacturing, marketing and other capabilities and a larger number of qualified managerial and technical personnel. |
23
| • | There is generally little or no publicly available information about our target tenants and borrowers. Many of our tenants and borrowers are likely to be privately owned businesses, about which there is generally little or no publicly available operating and financial information. As a result, we will rely on our Adviser to perform due diligence investigations of these tenants and borrowers, their operations and their prospects. We may not learn all of the material information we need to know regarding these businesses through our investigations. |
| • | Small and medium-sized businesses generally have less predictable operating results. We expect that many of our tenants and borrowers may experience significant fluctuations in their operating results, may from time to time be parties to litigation, may be engaged in rapidly changing businesses with products subject to a substantial risk of obsolescence, may require substantial additional capital to support their operations, to finance expansion or to maintain their competitive positions, may otherwise have a weak financial position or may be adversely affected by changes in the business cycle. Our tenants and borrowers may not meet net income, cash flow and other coverage tests typically imposed by their senior lenders. The failure of a tenant or borrower to satisfy financial or operating covenants imposed by senior lenders could lead to defaults and, potentially, foreclosure on credit facilities, which could additionally trigger cross-defaults in other agreements. If this were to occur, it is possible that the ability of the tenant or borrower to make required payments to us would be jeopardized. |
| • | Small and medium-sized businesses are more likely to be dependent on one or two persons. Typically, the success of a small or medium-sized business also depends on the management talents and efforts of one or two persons or a small group of persons. The death, disability or resignation of one or more of these persons could have a material adverse impact on our tenant or borrower and, in turn, on us. |
| • | Small and medium-sized businesses may have limited operating histories. While we intend to target as tenants and borrowers stable companies with proven track records, we may lease properties or lend money to new companies that meet our other investment criteria. Tenants or borrowers with limited operating histories will be exposed to all of the operating risks that new businesses face and may be particularly susceptible to, among other risks, market downturns, competitive pressures and the departure of key executive officers. |
We may not have funding for future tenant improvements.
When a tenant at one of our properties does not renew its lease or otherwise vacates its space in one of our buildings, it is likely that, in order to attract one or more new tenants, we will be required to expend substantial funds for tenant improvements and tenant refurbishments to the vacated space. We cannot assure you that we will have sufficient sources of funding available to us for such purposes in the future.
Illiquidity of real estate investments may make it difficult for us to sell properties in response to market conditions and could harm our financial condition and ability to make distributions.
To the extent the properties are not subject to triple-net leases, some significant expenditures, such as real estate taxes and maintenance costs, are generally not reduced when circumstances cause a reduction in income from the investment. Should these events occur, our income and funds available for distribution could be adversely affected. In addition, as a REIT, we may be subject to a 100% tax on net income derived from the sale of property considered to be held primarily for sale to customers in the ordinary course of our business. We may seek to avoid this tax by complying with certain safe harbor rules that generally limit the number of properties we may sell in a given year, the aggregate expenditures made on such properties prior to their disposition, and how long we retain such properties before disposing of them. However, we can provide no assurance that we will always be able to comply with these safe harbors. If compliance is possible, the safe harbor rules may restrict our ability to sell assets in the future and achieve liquidity that may be necessary to fund distributions.
24
Our real estate investments may include special use and single or multi-tenant properties that may be difficult to sell or re-lease upon tenant defaults or early lease terminations.
We focus our investments on commercial, industrial and retail properties, a number of which include manufacturing facilities, special use storage or warehouse facilities and special use single or multi-tenant properties. These types of properties are relatively illiquid compared to other types of real estate and financial assets. This illiquidity will limit our ability to quickly change our portfolio in response to changes in economic or other conditions. With these properties, if the current lease is terminated or not renewed or, in the case of a mortgage loan, if we take such property in foreclosure, we may be required to renovate the property or to make rent concessions in order to lease the property to another tenant or sell the property. In addition, in the event we are forced to sell the property, we may have difficulty selling it to a party other than the tenant or borrower due to the special purpose for which the property may have been designed.
These and other limitations may affect our ability to sell or re-lease properties without adversely affecting returns to our stockholders.
Our real estate investments have a limited number of tenants and are concentrated in a limited number of industries, which subjects us to an increased risk of significant loss if any one of these tenants is unable to pay or if particular industries experience downturns.
As of December 31, 2011, we owned 72 properties and had 57 tenants in these properties, and our 5 largest tenants accounted for approximately 23.5% of our total rental income. A consequence of a limited number of tenants is that the aggregate returns we realize may be substantially adversely affected by the unfavorable performance of a small number of tenants. We do not have fixed guidelines for industry concentration and our investments could potentially be concentrated in relatively few industries. As of December 31, 2011, 14.7% of our total rental income was earned from tenants in the healthcare, education, and childcare industry, 14.2% of our total rental income was earned from tenants in the telecommunication industries, and 13.9% of our total rental income was earned from tenants in the electronic industry. As a result, a downturn in an industry in which we have invested a significant portion of our total assets could have a material adverse effect on us.
The inability of a tenant in a single tenant property to pay rent will reduce our revenues and increase our carrying costs of the building.
Since most of our properties are occupied by a single tenant, the success of our investments will be materially dependent on the financial stability of these tenants. If a tenant defaults, our rental revenues would be reduced and our expenses associated with carrying the property would increase, as we would be responsible for payments such as taxes and insurance. Lease payment defaults by these tenants could adversely affect our cash flows and cause us to reduce the amount of distributions to stockholders. In the event of a default by a tenant, we may experience delays in enforcing our rights as landlord and may incur substantial costs in protecting our investment and re-leasing our property. If a lease is terminated, there is no assurance that we will be able to lease the property for the rent previously received or sell the property without incurring a loss.
We may be unable to renew leases, lease vacant space or re-lease space as leases expire, which could adversely affect our business and our ability to make distributions to our stockholders.
If we cannot renew leases, we may be unable to re-lease our properties to other tenants at rates equal to or above the current market rate. Even if we can renew leases, tenants may be able to negotiate lower rates as a result of market conditions. Market conditions may also hinder our ability to lease vacant space in newly developed or redeveloped properties. In addition, we may enter into or acquire leases for properties that are specially suited to the needs of a particular tenant. Such properties may require renovations, tenant improvements or other concessions in order to lease them to other tenants if the initial leases terminate. Any of these factors could adversely impact our financial condition, results of operations, cash flow, our ability to pay distributions to our stockholders.
25
Liability for uninsured losses could adversely affect our financial condition.
Losses from disaster-type occurrences (such as wars, floods or earthquakes) may be either uninsurable or not insurable on economically viable terms. Should an uninsured loss occur, we could lose our capital investment or anticipated profits and cash flow from one or more properties.
We could incur significant costs related to government regulation and private litigation over environmental matters.
Under various environmental laws, including the Comprehensive Environmental Response, Compensation and Liability Act, or CERCLA, a current or previous owner or operator of real property may be liable for contamination resulting from the release or threatened release of hazardous or toxic substances or petroleum at that property, and an entity that arranges for the disposal or treatment of a hazardous or toxic substance or petroleum at another property may be held jointly and severally liable for the cost to investigate and clean up such property or other affected property. Such parties are known as potentially responsible parties, or PRPs. Environmental laws often impose liability without regard to whether the owner or operator knew of, or was responsible for, the presence of the contaminants, and the costs of any required investigation or cleanup of these substances can be substantial. PRPs are liable to the government as well as to other PRPs who may have claims for contribution. The liability is generally not limited under such laws and could exceed the property’s value and the aggregate assets of the liable party. The presence of contamination or the failure to remediate contamination at our properties also may expose us to third-party liability for personal injury or property damage, or adversely affect our ability to sell, lease or develop the real property or to borrow using the real property as collateral.
Environmental laws also impose ongoing compliance requirements on owners and operators of real property. Environmental laws potentially affecting us address a wide variety of matters, including, but not limited to, asbestos-containing building materials, storage tanks, storm water and wastewater discharges, lead-based paint, wetlands and hazardous wastes. Failure to comply with these laws could result in fines and penalties and/or expose us to third-party liability. Some of our properties may have conditions that are subject to these requirements, and we could be liable for such fines or penalties and/or liable to third parties for those conditions.
We could be exposed to liability and remedial costs related to environmental matters.
Certain of our properties may contain, or may have contained, asbestos-containing building materials, or ACBMs. Environmental laws require that ACBMs be properly managed and maintained and may impose fines and penalties on building owners and operators for failure to comply with these requirements. Also, certain of our properties may contain, or may have contained, or are adjacent to or near other properties that have contained or currently contain storage tanks for the storage of petroleum products or other hazardous or toxic substances. These operations create a potential for the release of petroleum products or other hazardous or toxic substances. Certain of our properties may contain, or may have contained, elevated radon levels. Third parties may be permitted by law to seek recovery from owners or operators for property damage and/or personal injury associated with exposure to contaminants, including, but not limited to, petroleum products, hazardous or toxic substances and asbestos fibers. Also, certain of our properties may contain regulated wetlands that can delay or impede development or require costs to be incurred to mitigate the impact of any disturbance. Absent appropriate permits, we can be held responsible for restoring wetlands and be required to pay fines and penalties.
Certain of our properties may contain, or may have contained, microbial matter such as mold and mildew. The presence of microbial matter could adversely affect our results of operations. In addition, if any of our property is not properly connected to a water or sewer system, or if the integrity of such systems are breached, or if water intrusion into our buildings otherwise occurs, microbial matter or other contamination can develop. When excessive moisture accumulates in buildings or on building materials, mold growth may occur, particularly if the moisture problem remains undiscovered or is not addressed over a period of time. Some molds may produce airborne toxins or irritants. If this were to occur, we could incur significant remedial costs and we may also be subject to material private damage claims and awards. Concern about
26
indoor exposure to mold has been increasing, as exposure to mold may cause a variety of adverse health effects and symptoms, including allergic or other reactions. If we become subject to claims in this regard, it could materially and adversely affect us and our future insurability for such matters.
Independent environmental consultants conduct Phase I environmental site assessments on all of our acquisitions. Phase I environmental site assessments are intended to evaluate information regarding the environmental condition of the surveyed property and surrounding properties based generally on visual observations, interviews and certain publicly available databases. These assessments do not typically take into account all environmental issues including, but not limited to, testing of soil or groundwater or the possible presence of asbestos, lead-based paint, radon, wetlands or mold. The results of these assessments are addressed and could result in either a cancellation of the purchase, the requirement of the seller to remediate issues, or additional costs on our part to remediate the issue.
None of the previous site assessments revealed any past or present environmental liability that we believe would be material to us. However, the assessments may have failed to reveal all environmental conditions, liabilities or compliance concerns. Material environmental conditions, liabilities or compliance concerns may have arisen after the assessments were conducted or may arise in the future, and future laws, ordinances or regulations may impose material additional environmental liability. We cannot assure you that costs of future environmental compliance will not affect our ability to make distributions or that such costs or other remedial measures will not be material to us.
If a sale-leaseback transaction is re-characterized in a tenant’s bankruptcy proceeding, our financial condition could be adversely affected.
We may enter into sale-leaseback transactions, whereby we would purchase a property and then lease the same property back to the person from whom we purchased it. In the event of the bankruptcy of a tenant, a transaction structured as a sale-leaseback may be re-characterized as either a financing or a joint venture, either of which outcomes could adversely affect our business. If the sale-leaseback were re-characterized as a financing, we might not be considered the owner of the property, and as a result would have the status of a creditor in relation to the tenant. In that event, we would no longer have the right to sell or encumber our ownership interest in the property. Instead, we would have a claim against the tenant for the amounts owed under the lease, with the claim arguably secured by the property. The tenant/debtor might have the ability to propose a plan restructuring the term, interest rate and amortization schedule of its outstanding balance. If confirmed by the bankruptcy court, we could be bound by the new terms, and prevented from foreclosing our lien on the property. If the sale-leaseback were re-characterized as a joint venture, we could be treated as a co-venturer with our lessee with regard to the property. As a result, we could be held liable, under some circumstances, for debts incurred by the lessee relating to the property. Either of these outcomes could adversely affect our cash flow and our ability to pay distributions to stockholders.
Our properties may be subject to impairment charges, which could adversely affect our results of operations and FFO.
We are required to periodically evaluate our properties for impairment indicators. A property’s value is considered impaired if management’s estimate of the aggregate future cash flows (undiscounted and without interest charges) to be generated by the property, based upon its intended use, is less than the carrying value of the property. These estimates of cash flows are based upon factors such as expected future operating income, trends and prospects, as well as the effects of interest and capitalization rates, demand and occupancy, competition and other factors. Ongoing adverse market and economic conditions and market volatility make it difficult to value our properties. These factors may result in uncertainty in valuation estimates and instability in the estimated value of our properties which, in turn, could result in a substantial decrease in the value of the properties and significant impairment charges.
We continually assess our properties to determine if any impairments are necessary or appropriate. No assurance can be given that we will be able to recover the current carrying amount of our properties in the future. Our failure to do so would require us to recognize additional impairment charges for the period in which we reached that conclusion, which could materially and adversely affect us and our results of operations and FFO.
27
If we invest in mortgage loans, such investments may be affected by unfavorable real estate market conditions, including interest rate fluctuations, which could decrease the value of those loans and our results of operations.
If we invest in mortgage loans, we will be at risk of defaults by the borrowers on those mortgage loans as well as interest rate risks. To the extent we incur delays in liquidating such defaulted mortgage loans, we may not be able to obtain sufficient proceeds to repay all amounts due to us under the mortgage loans. Further, we will not know whether the values of the properties securing the mortgage loans will remain at the levels existing on the dates of origination of those mortgage loans. If the values of the underlying properties fall, our risk will increase because of the lower value of the security associated with such loans.
Risks related to our Adviser
We are dependent upon our key management personnel, who are employed by our Adviser, for our future success, particularly David Gladstone, Terry Lee Brubaker and George Stelljes III.
We are dependent on our senior management and other key management members to carry out our business and investment strategies. Our future success depends to a significant extent on the continued service and coordination of our senior management team, particularly David Gladstone, our chairman and chief executive officer, Terry Lee Brubaker, our vice chairman and chief operating officer, and George Stelljes III, our president and chief investment officer, all of whom are subject to an employment agreement with our Adviser. The departure of any of our executive officers or key employees could have a material adverse effect on our ability to implement our business strategy and to achieve our investment objectives.
Our success depends on the performance of our Adviser and if our Adviser makes inadvisable investment or management decisions, our operations could be materially adversely impacted.
Our ability to achieve our investment objectives and to pay distributions to our stockholders is dependent upon the performance of our Adviser in evaluating potential investments, selecting and negotiating property purchases and dispositions and mortgage loans, selecting tenants and borrowers, setting lease or mortgage loan terms and determining financing arrangements. Accomplishing these objectives on a cost-effective basis is largely a function of our Adviser’s marketing capabilities, management of the investment process, ability to provide competent, attentive and efficient services and our access to financing sources on acceptable terms. Our stockholders have no opportunity to evaluate the terms of transactions or other economic or financial data concerning our investments and must rely entirely on the analytical and management abilities of our Adviser and the oversight of our Board of Directors. If our Adviser or our Board of Directors makes inadvisable investment or management decisions, our operations could be materially adversely impacted. As we grow, our Adviser may be required to hire, train, supervise and manage new employees. Our Adviser’s failure to effectively manage our future growth could have a material adverse effect on our business, financial condition and results of operations.
We may have conflicts of interest with our Adviser and other affiliates.
Our Adviser manages our business and locates, evaluates, recommends and negotiates the acquisition of our real estate investments. At the same time, our advisory agreement permits our Adviser to conduct other commercial activities and provide management and advisory services to other entities, including, but not limited to, Gladstone Capital Corporation, or Gladstone Capital, Gladstone Investment Corporation, or Gladstone Investment, and Gladstone Land Corporation, or Gladstone Land, an entity owned by our chairman David Gladstone. Moreover, with the exception of our chief financial officer, all of our officers and directors are also officers and directors of Gladstone Capital and Gladstone Investment, which actively make loans to and invest in small and medium-sized companies. As a result, we may from time to time have conflicts of interest with our Adviser in its management of our business and with Gladstone Capital and Gladstone Investment, which may arise primarily from the involvement of our Adviser, Gladstone Capital, Gladstone Investment, Gladstone Land and their affiliates in other activities that may conflict with our business.
28
Examples of these potential conflicts include:
| • | our Adviser may realize substantial compensation on account of its activities on our behalf, and may, therefore, be motivated to approve acquisitions solely on the basis of increasing compensation to itself; |
| • | we may experience competition with our affiliates for financing transactions; |
| • | our Adviser may earn fee income from our borrowers or tenants; and |
| • | our Adviser and other affiliates such as Gladstone Capital, Gladstone Investment and Gladstone Land could compete for the time and services of our officers and directors. |
These and other conflicts of interest between us and our Adviser and other affiliates could have a material adverse effect on the operation of our business and the selection or management of our real estate investments.
Our Adviser is not obligated to provide a waiver of the incentive fee, which could negatively impact our earnings and our ability to maintain our current level of, or increase, distributions to our stockholders.
The Advisory Agreement contemplates a quarterly incentive fee based on our funds from operations. Our Adviser has the ability to issue a full or partial waiver of the incentive fee for current and future periods; however, our Adviser is not required to issue any waiver. Any waiver issued by our Adviser is an unconditional and irrevocable waiver. For the years ended December 31, 2011, 2010 and 2009, an unconditional and irrevocable voluntary waiver was issued by our Adviser for approximately $2.1 million, $0.2 million and $0.7 million, respectively. If our Adviser does not issue this waiver in future quarters, it could negatively impact our earnings and may compromise our ability to maintain our current level of, or increase, distributions to our stockholders, which could have a material adverse impact on the market price of our securities.
We may be obligated to pay our Adviser incentive compensation even if we incur a loss.
The Advisory Agreement entitles our Adviser to incentive compensation based on our FFO, which rewards the Adviser if our quarterly FFO (before giving effect to any incentive fee) exceeds 1.75% (7% annualized) of our total stockholders’ equity (less the recorded value of any preferred stock). Our pre-incentive fee FFO for incentive compensation purposes excludes the effect of any unrealized gains, losses or other items that do not affect realized net income that we may incur in the fiscal quarter, even if such losses result in a net loss on our statement of operations for that quarter. Thus, we may be required to pay our Adviser incentive compensation for a fiscal quarter even if we incur a net loss for that quarter.
Risks Related to Qualification and Operation as a REIT
If we fail to qualify as a REIT, our operations and dividends to stockholders would be adversely impacted.
We intend to continue to be organized and to operate so as to qualify as a REIT under the Internal Revenue Code of 1986, as amended, or the Code. A REIT generally is not taxed at the corporate level on income it currently distributes to its stockholders. Qualification as a REIT involves the application of highly technical and complex rules for which there are only limited judicial or administrative interpretations. The determination of various factual matters and circumstances not entirely within our control may affect our ability to continue to qualify as a REIT. In addition, new legislation, new regulations, administrative interpretations or court decisions could significantly change the tax laws, possibly with retroactive effect, with respect to qualification as a REIT or the federal income tax consequences of such qualification.
29
If we were to fail to qualify as a REIT in any taxable year:
| • | we would not be allowed to deduct our distributions to stockholders when computing our taxable income; |
| • | we would be subject to federal income tax (including any applicable alternative minimum tax) on our taxable income at regular corporate rates; |
| • | we would be disqualified from being taxed as a REIT for the four taxable years following the year during which qualification was lost, unless entitled to relief under certain statutory provisions; |
| • | our cash available for dividends to stockholders would be reduced; and |
| • | we may be required to borrow additional funds or sell some of our assets in order to pay corporate tax obligations that we may incur as a result of our disqualification. |
We may need to incur additional borrowings to meet the REIT minimum distribution requirement and to avoid excise tax.
In order to maintain our qualification as a REIT, we are required to distribute to our stockholders at least 90% of our annual real estate investment trust taxable income (excluding any net capital gain and before application of the dividends paid deduction). To the extent that we satisfy this distribution requirement, but distribute less than 100% of our taxable income, we will be subject to federal corporate income tax on our undistributed taxable income. In addition, we are subject to a 4% nondeductible excise tax on the amount, if any, by which certain distributions paid by us with respect to any calendar year are less than the sum of (i) 85% of our ordinary income for that year, (ii) 95% of our net capital gain for that year and (iii) 100% of our undistributed taxable income from prior years. In order to meet the 90% distribution requirement and to avoid the 4% excise tax, we may need to incur additional borrowings. Although we intend to pay dividends to our stockholders in a manner that allows us to meet the 90% distribution requirement and avoid this 4% excise tax, we cannot assure you that we will always be able to do so.
Complying with the REIT requirements may cause us to forgo otherwise attractive opportunities or liquidate otherwise attractive investments.
To qualify as a REIT for federal income tax purposes, we must continually satisfy tests concerning, among other things, the nature and diversification of our assets, the sources of our gross income, the amounts we distribute to our stockholders and the ownership of our capital stock. In order to meet these tests, we may be required to forgo investments we might otherwise make. Thus, compliance with the REIT requirements may hinder our performance.
In particular, we must ensure that at the end of each calendar quarter, at least 75% of the value of our assets consists of cash, cash items, government securities and qualified real estate assets. The remainder of our investment in securities (other than government securities, securities of taxable REIT subsidiaries (each, a taxable REIT subsidiary, or TRS) and qualified real estate assets) generally cannot include more than 10% of the outstanding voting securities of any one issuer or more than 10% of the total value of the outstanding securities of any one issuer. In addition, in general, no more than 5% of the value of our assets (other than government securities, securities of TRSs and qualified real estate assets) can consist of the securities of any one issuer, and no more than 25% of the value of our total assets can be represented by the securities of one or more TRSs.
We also must ensure that (i) at least 75% of our gross income for each taxable year consists of certain types of income that we derive, directly or indirectly, from investments relating to real property or mortgages on real property or qualified temporary investment income and (ii) at least 95% of our gross income for each taxable year consists of income that is qualifying income for purposes of the 75% gross income test, other types of interest and dividends, gain from the sale or disposition of stock or securities, or any combination of these.
30
In addition, we may be required to make distributions to our stockholders at disadvantageous times or when we do not have funds readily available for distribution. If we fail to comply with these requirements at the end of any calendar quarter, we must qualify for certain statutory relief provisions to avoid losing our REIT qualification and suffering adverse tax consequences. As a result, we may be required to liquidate otherwise attractive investments, and may be unable to pursue investments that would otherwise be advantageous to us in order to satisfy the asset and gross income requirements for qualifying as a REIT. These actions could have the effect of reducing our income and the amounts available for distribution to our stockholders. Thus, compliance with the REIT requirements may hinder our ability to make, and, in certain cases, maintain ownership of certain attractive investments.
We may be subject to adverse legislative or regulatory tax changes that could reduce the market price of our securities.
At any time, the federal income tax laws governing REITs or the administrative interpretations of those laws may be amended. We cannot predict when or if any new federal income tax law, regulation, or administrative interpretation, or any amendment to any existing federal income tax law, regulation or administrative interpretation, will be adopted, promulgated or become effective and any such law, regulation, or interpretation may take effect retroactively. We and our stockholders could be adversely affected by any such change in, or any new, federal income tax law, regulation or administrative interpretation.
Dividends payable by REITs do not qualify for the reduced tax rates available for some dividends.
The maximum tax rate applicable to income from “qualified dividends” payable to U.S. stockholders that are individuals, trusts and estates has been reduced by legislation to 15% (currently through the end of 2012). Dividends payable by REITs, however, generally are not eligible for the reduced rates. Although this legislation does not adversely affect the taxation of REITs or dividends payable by REITs, the more favorable rates applicable to regular corporate qualified dividends could cause investors who are individuals, trusts and estates to perceive investments in REITs to be relatively less attractive than investments in the stocks of non-REIT corporations that pay dividends, which could adversely affect the value of the shares of REITs, including our stock.
Complying with the REIT requirements may limit our ability to hedge effectively and may cause us to incur tax liabilities.
The REIT provisions of the Code substantially limit our ability to hedge our liabilities. Any income from a hedging transaction that we enter into to manage risk of interest rate changes, price changes or currency fluctuations with respect to borrowings made or to be made to acquire or carry real estate assets does not constitute “gross income” for purposes of the gross income requirements. To the extent that we enter into other types of hedging transactions, the income from those transactions is likely to be treated as non-qualifying income for purposes of both of the gross income tests. As a result of these rules, we may need to limit our use of advantageous hedging techniques or implement those hedges through TRSs. This could increase the cost of our hedging activities because any TRS would be subject to tax on gains or expose us to greater risks associated with changes in interest rates than we would otherwise want to bear. In addition, losses incurred by a TRS generally will not provide any tax benefit, except for being carried forward against future taxable income earned by the TRS.
To the extent that our distributions represent a return of capital for tax purposes, you could recognize an increased capital gain upon a subsequent sale of your stock.
Distributions in excess of our current and accumulated earnings and profits and not treated by us as a dividend will not be taxable to a U.S. stockholder to the extent such distributions do not exceed the stockholder’s adjusted tax basis in its shares of our stock but instead will constitute a return of capital and will reduce the stockholder’s adjusted tax basis in its shares of our stock. If our distributions result in a reduction of a stockholder’s adjusted basis in its shares of our stock, subsequent sales by such stockholder of its shares of our stock potentially will result in recognition of an increased capital gain or reduced capital loss due to the reduction in such stockholder’s adjusted basis in its shares of our stock.
31
If our Operating Partnership fails to maintain its status as a disregarded entity or partnership for federal income tax purposes, its income may be subject to taxation.
As we hold all of the ownership interests in our Operating Partnership, it is currently disregarded for income tax purposes. We intend that our Operating Partnership will qualify as a partnership for income tax purposes upon the admission of additional partners; however, if the IRS were to successfully challenge the status of our Operating Partnership as a partnership, it would be taxable as a corporation. In such event, this would reduce the amount of distributions that our Operating Partnership could make to us. This could also result in our losing REIT status and becoming subject to corporate level tax on our income. This would substantially reduce our cash available to pay distributions and the return on your investment. In addition, if any of the entities through which our Operating Partnership owns its properties, in whole or in part, loses its characterization as a disregarded entity or a partnership for federal income tax purposes, it would be subject to taxation as a corporation, thereby reducing distributions to our Operating Partnership. Such a re-characterization of an underlying property owner could also threaten our ability to maintain REIT status.
Other risks
We are subject to restrictions that may discourage a change of control. Certain provisions contained in our articles of incorporation and Maryland law may prohibit or restrict a change of control.
| • | Our articles of incorporation prohibit ownership of more than 9.8% of the outstanding shares of our capital stock by one person. This restriction may discourage a change of control and may deter individuals or entities from making tender offers for our capital stock, which offers might otherwise be financially attractive to our stockholders or which might cause a change in our management. |
| • | Our Board of Directors is divided into three classes, with the term of the directors in each class expiring every third year. At each annual meeting of stockholders, the successors to the class of directors whose term expires at such meeting will be elected to hold office for a term expiring at the annual meeting of stockholders held in the third year following the year of their election. After election, a director may only be removed by our stockholders for cause. Election of directors for staggered terms with limited rights to remove directors makes it more difficult for a hostile bidder to acquire control of us. The existence of this provision may negatively impact the price of our securities and may discourage third-party bids to acquire our securities. This provision may reduce any premiums paid to stockholders in a change in control transaction. |
| • | Certain provisions of Maryland law applicable to us prohibit business combinations with: |
| • | any person who beneficially owns 10% or more of the voting power of our common stock, referred to as an “interested stockholder;” |
| • | an affiliate of ours who, at any time within the two-year period prior to the date in question, was an interested stockholder; or |
| • | an affiliate of an interested stockholder. |
These prohibitions last for five years after the most recent date on which the interested stockholder became an interested stockholder. Thereafter, any business combination with the interested stockholder must be recommended by our Board of Directors and approved by the affirmative vote of at least 80% of the votes entitled to be cast by holders of our outstanding shares of common stock and two-thirds of the votes entitled to be cast by holders of our common stock other than shares held by the interested stockholder. These requirements could have the effect of inhibiting a change in control even if a change in control were in our stockholders’ interest. These provisions of Maryland law do not apply, however, to business combinations that are approved or exempted by our Board of Directors prior to the time that someone becomes an interested stockholder.
32
Market conditions could adversely affect the market price and trading volume of our securities.
The market price of our common and preferred stock may be highly volatile and subject to wide fluctuations, and the trading volume in our common and preferred stock may fluctuate and cause significant price variations to occur. Due to market volatility, our common stock significantly fluctuated during 2011. We cannot assure investors that the market price of our common and preferred stock will not fluctuate or decline further in the future. Some market conditions that could negatively affect our share price or result in fluctuations in the price or trading volume of our securities include, but are not limited to:
| • | price and volume fluctuations in the stock market from time to time, which are often unrelated to the operating performance of particular companies; |
| • | significant volatility in the market price and trading volume of shares of REITs, real estate companies or other companies in our sector, which is not necessarily related to the performance of those companies; |
| • | price and volume fluctuations in the stock market as a result of terrorist attacks, or speculation regarding future terrorist attacks, in the United States or abroad; |
| • | actual or anticipated variations in our quarterly operating results or distributions to stockholders; |
| • | changes in our funds from operations or earnings estimates or the publication of research reports about us or the real estate industry generally; |
| • | actions by institutional stockholders; |
| • | speculation in the press or investment community; |
| • | changes in regulatory policies or tax guidelines, particularly with respect to REITs; and |
| • | investor confidence in the stock market. |
Shares of common stock eligible for future sale may have adverse effects on our share price.
We cannot predict the effect, if any, of future sales of common stock, or the availability of shares for future sales, on the market price of our common stock. Sales of substantial amounts of common stock (including shares of common stock issuable upon the conversion of units of our operating partnership that we may issue from time to time or issuable upon conversion of our senior common stock), or the perception that these sales could occur, may adversely affect prevailing market prices for our common stock.
Legislative or regulatory action could adversely affect investors.
In recent years, numerous legislative, judicial and administrative changes have been made in the provisions of the federal and state income tax laws applicable to investments in stock of REITs. Additional changes to tax laws are likely to continue to occur in the future, and we cannot assure you that any such changes will not adversely affect the taxation of our stockholders. Any such changes could have an adverse effect on an investment in our shares or on the market value or the resale potential of our properties.
Compliance or failure to comply with laws requiring access to our properties by disabled persons could result in substantial cost.
The Americans with Disabilities Act, or ADA, and other federal, state and local laws generally require public accommodations be made accessible to disabled persons. Noncompliance could result in the imposition of fines by the government or the award of damages to private litigants. These laws may require us to modify our existing properties. These laws may also restrict renovations by requiring improved access to such buildings by disabled persons or may require us to add other structural features which increase our construction costs. Legislation or regulations adopted in the future may impose further burdens or restrictions on us with respect to improved access by disabled persons. We may incur unanticipated expenses that may be material to our financial condition or results of operations to comply with ADA and other federal, state and local laws, or in connection with lawsuits brought by private litigants.
33
Our Board of Directors may change our investment policy without stockholders’ approval.
Subject to our co-investment policy, our Board of Directors will determine our investment and financing policies, growth strategy and our debt, capitalization, distribution, acquisition, disposition and operating policies. Our Board of Directors may revise or amend these strategies and policies at any time without a vote by stockholders. Accordingly, stockholders’ control over changes in our strategies and policies is limited to the election of directors, and changes made by our Board of Directors may not serve the interests of stockholders and could adversely affect our financial condition or results of operations, including our ability to distribute cash to stockholders or qualify as a REIT.
Our failure to redeem our Series C Term Preferred Stock on its Mandatory Redemption Date could trigger a change of control in our Board of Directors.
If we fail to redeem or call for redemption the Series C Term Preferred Stock pursuant to the mandatory redemption required on January 31, 2017, the number of directors constituting our Board of Directors will be increased by the minimum number of directors, that when added to our Board of Directors, will constitute a majority, and the holders of our Series C Term Preferred Stock will be entitled, voting as a separate class (to the exclusion of the holders of all other classes or series of our stock), to elect such number of additional directors.
Joint venture investments could be adversely affected by our lack of sole decision making authority, our reliance on co-venturers’ financial condition and disputes between our co-venturers and us.
We may invest with third parties through partnerships, joint ventures or other entities, acquiring non-controlling interests in or sharing responsibility for managing the affairs of a property, partnership, joint venture or other entity. In such event, we will not have sole decision-making authority regarding the property, partnership, joint venture or other entity. Investments in partnerships, joint ventures or other entities may, under certain circumstances, involve risks not present were a third party not involved, including the possibility that partners or co-venturers may become bankrupt or fail to fund their share of required capital contributions. Partners or co-venturers also may have economic or other business interests or goals that are inconsistent with our business interests or goals and may be in a position to take actions contrary to our preferences, policies or objectives. Such investments also will have the potential risk of our reaching impasses with our partners or co-venturers on key decisions, such as a sale, because neither we nor the partner or co-venturer would have full control over the partnership or joint venture. Disputes between us and partners or co-venturers may result in litigation or arbitration that would increase our expenses and prevent our management team from focusing its time and effort exclusively on our business. In addition, we may in some circumstances be liable for the actions of our third-party partners or co-venturers.
Our rights and the rights of our stockholders to take action against our directors and officers are limited.
Maryland law provides that a director or officer has no liability in that capacity if he or she performs his or her duties in good faith, in a manner he or she reasonably believes to be advisable and in our best interests and with the care that an ordinarily prudent person in a like position would use under similar circumstances. In addition, our charter (i) eliminates our directors’ and officers’ liability to us and our stockholders for money damages except for liability resulting from actual receipt of an improper benefit in money, property or services or active and deliberate dishonesty established by a final judgment and that is material to the cause of action and (ii) requires us to indemnify directors and officers for liability resulting from actions taken by them in those capacitates to the maximum extent permitted by Maryland law. As a result, our stockholders and we may have more limited rights against our directors and officers than might otherwise exist under common law. In addition, we may be obligated to fund the defense costs incurred by our directors and officers.
34
| Item 1B. | Unresolved Staff Comments. |
None.
35
| Item 2. | Properties. |
The following table provides certain summary information about our 72 properties as of December 31, 2011.
| Property |
Year Built/ Improvements |
Date of Purchase | Rentable Square Feet |
Occupancy | Year of Lease Expiration |
Total Rental Income for the year ended December 31, 2011 (4) (Dollars in Thousands) |
Total Rental Income per Occupied Square Foot |
Encumbrances (Dollars in Thousands) |
||||||||||||||||||||||||
| 208 South Rogers Lane (Raleigh NC) |
1997 | 12/23/2003 | 58,926 | 100 | % | 2015 | $ | 623 | $ | 10.57 | $ | 4,939 | ||||||||||||||||||||
| 3874 Highland Park NW (Canton, OH) |
1994 | 1/30/2004 | 54,018 | 100 | % | 2014 | $ | 338 | $ | 6.26 | 2,816 | |||||||||||||||||||||
| 260 Springside Drive (Akron, OH) |
1968/1999 | 4/29/2004 | 83,891 | 100 | % | 2015 | $ | 1,027 | $ | 12.24 | 7,217 | |||||||||||||||||||||
| 5815 Westpark Drive (Charlotte, NC) |
1984/1995 | 6/30/2004 | 64,500 | 100 | % | 2019 | $ | 1,032 | $ | 16.00 | 6,690 | |||||||||||||||||||||
| 171 Great Oak Drive (Canton, NC) |
1998 | 7/6/2004 | 228,000 | 100 | % | 2024 | $ | 600 | $ | 2.63 | 2,314 | |||||||||||||||||||||
| Rt. 219, Tax Parcel No. 33-251-0246, (Snyder Township, PA) |
1991 | 8/5/2004 | 290,000 | 100 | % | 2014 | $ | 931 | $ | 3.21 | 5,462 | |||||||||||||||||||||
| 9698 Old US Hwy. 52 (Lexington, NC) |
1986 | 8/5/2004 | 154,000 | 100 | % | 2014 | $ | 425 | $ | 2.76 | 2,771 | |||||||||||||||||||||
| 9100 Highway 290 East (Austin, TX) |
2001 | 9/16/2004 | 51,933 | 100 | % | 2015 | $ | 751 | $ | 14.46 | 6,500 | |||||||||||||||||||||
| 13 Industrial Park Drive (Mt. Pocono, PA) |
1995-1999 | 10/15/2004 | 223,275 | 100 | % | 2021 | $ | 633 | $ | 2.84 | 5,113 | |||||||||||||||||||||
| 6550 First Park Ten Boulevard (San Antonio, TX) |
1999 | 2/10/2005 | 60,245 | 100 | % | 2014 | $ | 770 | $ | 12.78 | 6,982 | |||||||||||||||||||||
| 4630 Journal Street (Columbus, OH) |
1995 | 2/10/2005 | 39,000 | 100 | % | 2015 | $ | 308 | $ | 7.90 | 2,655 | |||||||||||||||||||||
| 199 Sing Sing Road (Big Flats, NY) |
2001 | 4/15/2005 | 120,000 | 100 | % | 2013 | $ | 644 | $ | 5.37 | 5,587 | |||||||||||||||||||||
| 2525 North Woodlawn Avenue (Wichita, KS) |
2000 | 5/18/2005 | 69,287 | 100 | % | 2012 | $ | 1,109 | $ | 16.01 | 8,129 | |||||||||||||||||||||
| 725 & 737 Great Southwest Pkwy (Arlington, TX) |
1966 | 5/26/2005 | 64,000 | 100 | % | 2013 | $ | 663 | $ | 10.36 | 4,008 | |||||||||||||||||||||
| 4032 Linden Avenue (Dayton, OH) |
1956 | 6/30/2005 | 59,894 | 100 | % | 2018 | $ | 268 | $ | 4.47 | 1,984 | |||||||||||||||||||||
| 81 Corbett Way (Eatontown, NJ) |
1991 | 7/7/2005 | 30,268 | 100 | % | 2024 | $ | 537 | $ | 17.74 | 4,545 | |||||||||||||||||||||
| 17 & 20 Veronica Avenue (Franklin Township, NJ) |
1978 | 7/11/2005 | 183,000 | 100 | % | 2020 | $ | 983 | $ | 5.37 | 6,739 | |||||||||||||||||||||
| 150 Ridgeview Center Drive (Duncan, SC) |
1984/2001/2007 | 7/14/2005 | 222,670 | 100 | % | 2020 | $ | 1,539 | $ | 6.91 | 11,005 | |||||||||||||||||||||
| 170 Ridgeview Center Drive (Duncan, SC) |
1984/2001/2007 | 7/14/2005 | 55,350 | 100 | % | 2020 | $ | 383 | $ | 6.92 | 2,735 | |||||||||||||||||||||
| 5656 Campus Parkway (Hazelwood, MO) |
1977 | 8/5/2005 | 51,155 | 0 | % | 2011 | $ | 86 | $ | 1.68 | 2,360 | |||||||||||||||||||||
| 914 Wohlert Street (Angola, IN) |
1982 | 9/2/2005 | 52,080 | 100 | % | 2023 | $ | 126 | $ | 2.42 | 682 | |||||||||||||||||||||
| 800 Growth Parkway (Angola, IN) |
1998 | 9/2/2005 | 50,000 | 100 | % | 2023 | $ | 126 | $ | 2.52 | 655 | |||||||||||||||||||||
| 802 East 11th Street (Rock Falls, IL) |
1988 | 9/2/2005 | 52,000 | 100 | % | 2023 | $ | 126 | $ | 2.42 | 681 | |||||||||||||||||||||
| 2 Opportunity Way (Newburyport, MA) |
1994 | 10/17/2005 | 86,308 | 100 | % | 2015 | $ | 891 | $ | 10.32 | 6,593 | |||||||||||||||||||||
| 255 Spring Street (Clintonville, WI) |
1992 | 10/31/2005 | 291,142 | 100 | % | 2020 | $ | 575 | $ | 1.97 | 3,263 | |||||||||||||||||||||
| 5700 Lee Road (Maple Heights, OH) |
1974 | 12/21/2005 | 347,218 | 100 | % | 2015 | $ | 1,271 | $ | 3.66 | 10,332 | |||||||||||||||||||||
36
| Property |
Year Built/ Improvements |
Date of Purchase | Rentable Square Feet |
Occupancy | Year of Lease Expiration |
Total Rental Income for the year ended December 31, 2011 (4) (Dollars in Thousands) |
Total Rental Income per Occupied Square Foot |
Encumbrances (Dollars in Thousands) |
||||||||||||||||||||||||
| 7545 Midlothian Turnpike (Richmond, VA) |
1972 | 12/30/2005 | 42,213 | 0 | % | 2010 | $ | — | $ | — | 5,275 | |||||||||||||||||||||
| 3930 Sunforest Court (Toledo, OH) |
1979 | 12/30/2005 | 23,368 | 100 | % | 2020 | $ | 276 | $ | 11.81 | 2,889 | |||||||||||||||||||||
| 75 Canal Street (South Hadley, MA) |
1978 | 2/15/2006 | 150,000 | 100 | % | 2012 | $ | 134 | $ | 1.61 | — | |||||||||||||||||||||
| 2101 Fox Drive (Champaign, IL) |
1996 | 2/21/2006 | 20,400 | 100 | % | 2013 | $ | 273 | $ | 13.38 | 1,667 | |||||||||||||||||||||
| 2109 Fox Drive (Champaign, IL) |
1996 | 2/21/2006 | 40,000 | 100 | % | 2013 | $ | 535 | $ | 13.38 | 3,268 | |||||||||||||||||||||
| 2215 Fox Drive (Champaign, IL) |
1996 | 2/21/2006 | 25,000 | 100 | % | 2013 | $ | 334 | $ | 13.36 | 2,042 | |||||||||||||||||||||
| 2301 Fox Drive (Champaign, IL) |
1996 | 2/21/2006 | 22,862 | 100 | % | 2013 | $ | 306 | $ | 13.38 | 1,868 | |||||||||||||||||||||
| 2470 Highcrest Road (Roseville, MN) |
1964 | 2/21/2006 | 359,540 | 100 | % | 2012 | $ | 3,031 | $ | 8.43 | 18,345 | |||||||||||||||||||||
| 12000 Portland Avenue South |
1984 | 5/10/2006 | 114,100 | 100 | % | 2015 | $ | 1,235 | $ | 10.82 | 11,556 | |||||||||||||||||||||
| 14701 Anthony Avenue |
1986/2000 | 6/30/2006 | 125,692 | 100 | % | 2016 | $ | 783 | $ | 6.23 | 6,940 | |||||||||||||||||||||
| 1025 Birdsong Drive (Baytown, TX) |
1997 | 7/11/2006 | 12,000 | 100 | % | 2013 | $ | 254 | $ | 21.17 | 2,000 | |||||||||||||||||||||
| 42400 Merrill Road (Sterling Heights, MI) |
1979/1989 | 9/22/2006 | 532,869 | 100 | % | 2016 | $ | 1,167 | $ | 2.19 | — | |||||||||||||||||||||
| 2150, 2200 Pinson Valley Parkway (Birmingham, AL) |
1961/1980 | 9/29/2006 | 63,514 | 100 | % | 2016 | $ | 271 | $ | 4.27 | — | |||||||||||||||||||||
| 2325 West Fairview Avenue |
1962/1989 | 9/29/2006 | 29,472 | 100 | % | 2016 | $ | 126 | $ | 4.28 | — | |||||||||||||||||||||
| 5221 N Highway 763 (Columbia, MO) |
1978 | 9/29/2006 | 16,275 | 100 | % | 2016 | $ | 69 | $ | 4.24 | — | |||||||||||||||||||||
| 4690 Parkway Drive |
2002 | 1/5/2007 | 60,000 | 100 | % | 2013 | $ | 681 | $ | 11.35 | 5,357 | |||||||||||||||||||||
| 201 South Rogers Lane |
1994 | 2/16/2007 | 115,500 | 100 | % | 2015 | $ | 717 | $ | 6.21 | 5,401 | |||||||||||||||||||||
| 1110 West Tenkiller (Tulsa, OK) (3) |
2004 | 3/1/2007 | 238,310 | 100 | % | 2019 | $ | 1,566 | $ | 6.57 | 8,500 | |||||||||||||||||||||
| 3725 East 10th Court (Hialeah, FL) |
1956/1992 | 3/9/2007 | 132,337 | 100 | % | 2022 | $ | 1,013 | $ | 7.65 | — | |||||||||||||||||||||
| 554 Clark Road (Tewksbury, MA) |
1985/1989 | 5/17/2007 | 102,200 | 100 | % | 2017 | $ | 922 | $ | 9.02 | — | |||||||||||||||||||||
| 5324 Natorp Boulevard |
2007 | 7/1/2007 | 21,264 | 100 | % | 2027 | $ | 583 | $ | 27.42 | 4,764 | |||||||||||||||||||||
| 7282 Willam Barry Boulevard |
2005 | 9/6/2007 | 71,880 | 100 | % | 2020 | $ | 530 | $ | 7.37 | 4,219 | |||||||||||||||||||||
| 1515 Arboretum Drive SE (Grand Rapids, MI) |
2001 | 9/28/2007 | 63,235 | 100 | % | 2025 | $ | 1,088 | $ | 17.21 | 9,152 | |||||||||||||||||||||
| 4 Territorial Court (Bollingbrook, IL) |
2002 | 9/28/2007 | 55,869 | 100 | % | 2014 | $ | 619 | $ | 11.08 | 4,929 | |||||||||||||||||||||
| 2349 Lawrenceville Highway (Decatur, GA) |
1989 | 12/13/2007 | 16,740 | 100 | % | 2031 | $ | 469 | $ | 28.02 | 3,257 | |||||||||||||||||||||
| 2341 Lawrenceville Highway (Decatur, GA) |
1989 | 12/13/2007 | 4,372 | 100 | % | 2031 | $ | 123 | $ | 28.13 | 851 | |||||||||||||||||||||
| 2339 Lawrenceville Highway (Decatur, GA) |
1989 | 12/13/2007 | 5,488 | 100 | % | 2031 | $ | 154 | $ | 28.06 | 1,068 | |||||||||||||||||||||
37
| Property |
Year Built/ Improvements |
Date of Purchase | Rentable Square Feet |
Occupancy | Year of Lease Expiration |
Total Rental Income for the year ended December 31, 2011 (4) (Dollars in Thousands) |
Total Rental Income per Occupied Square Foot |
Encumbrances (Dollars in Thousands) |
||||||||||||||||||||||||
| 311 Phillip Boulevard (Lawrenceville, GA) |
2005 | 12/13/2007 | 12,412 | 100 | % | 2031 | $ | 407 | $ | 32.79 | 2,820 | |||||||||||||||||||||
| 2096 McGee Road (Snellville, GA) |
1986 | 12/13/2007 | 3,800 | 100 | % | 2031 | $ | 106 | $ | 27.89 | 732 | |||||||||||||||||||||
| 7174 Wheat Street (Covington, GA) |
2000 | 12/13/2007 | 5,000 | 100 | % | 2031 | $ | 139 | $ | 27.80 | 963 | |||||||||||||||||||||
| 1055 Haw Creek Parkway (Cumming, GA) |
2004 | 12/13/2007 | 13,919 | 100 | % | 2031 | $ | 442 | $ | 31.76 | 3,066 | |||||||||||||||||||||
| 1293 Wellbrook Circle (Conyers, GA) |
1994 | 12/13/2007 | 6,400 | 100 | % | 2031 | $ | 178 | $ | 27.81 | 1,233 | |||||||||||||||||||||
| 425 Gateway Drive (Reading, PA) |
2007 | 1/29/2008 | 42,900 | 100 | % | 2028 | $ | 717 | $ | 16.71 | 5,214 | |||||||||||||||||||||
| 6499 University Avenue NE (Fridley, MN) |
1985/2006 | 2/26/2008 | 74,160 | 100 | % | 2020 | $ | 812 | $ | 10.95 | — | |||||||||||||||||||||
| 7528 Auburn Road |
1957/2008 | 3/31/2008 | 273,300 | 100 | % | 2028 | $ | 1,724 | $ | 6.31 | — | |||||||||||||||||||||
| 10021 Rodney Street (Pineville, NC) |
1985 | 4/30/2008 | 74,950 | 100 | % | 2028 | $ | 431 | $ | 5.75 | 2,128 | |||||||||||||||||||||
| 28305 State Route 7 (Marietta, OH) |
1992/2007 | 8/29/2008 | 223,458 | 100 | % | 2028 | $ | 905 | $ | 4.05 | 4,464 | |||||||||||||||||||||
| 400 Highpoint Drive |
1987 | 8/29/2008 | 67,200 | 100 | % | 2016 | $ | 758 | $ | 11.28 | 6,019 | |||||||||||||||||||||
| 1520 Albany Place SE (Orange City, Iowa) |
1990 | 12/15/2010 | 487,121 | 100 | % | 2026 | $ | 1,169 | $ | 2.40 | 10,402 | |||||||||||||||||||||
| 2415 Century Place SE (Hickory, North Carolina) |
2008 | 4/4/2011 | 60,000 | 100 | %(2) | 2020 | $ | 693 | $ | 16.00 | — | |||||||||||||||||||||
| 2645 North Airport Plaza Avenue, Lot 2 (Springfield, MO) |
2006 | 6/20/2011 | 78,421 | 100 | %(2) | 2021 | $ | 755 | $ | 16.42 | 11,505 | |||||||||||||||||||||
| 124 East Hines Road (Boston Heights, OH) |
2011 | 10/20/2011 | 25,000 | 100 | %(2) | 2021 | $ | 74 | $ | 13.75 | — | |||||||||||||||||||||
| 9 Sylvan Way (Parsippany, NJ) |
1984 | 10/28/2011 | 60,111 | 100 | %(2) | 2026 | $ | 204 | $ | 17.02 | 7,190 | |||||||||||||||||||||
| 495 State Road (Dartmouth, MA) (3)(5) |
2011 | 11/18/2011 | 16,340 | 100 | %(2) | 2086 | $ | 74 | $ | 37.28 | 4,352 | |||||||||||||||||||||
| 1955 South National Avenue (Springfield, MO) (3)(6) |
2005 | 12/13/2011 | 14,560 | 100 | %(2) | 2080 | $ | 16 | $ | 21.66 | — | |||||||||||||||||||||
| 810 Parish Street (Pittsburgh, PA) |
1968 | 12/28/2011 | 26,080 | 100 | %(2) | 2026 | $ | 4 | $ | 13.05 | — | |||||||||||||||||||||
|
|
|
|
|
|
|
|||||||||||||||||||||||||||
| Totals |
7,071,792 | $ | 43,632 | $ | 286,193 | |||||||||||||||||||||||||||
|
|
|
|
|
|
|
|||||||||||||||||||||||||||
| (1) | Two tenants occupy this building, each with separate leases ending in the same year. |
| (2) | Rental income per occupied square foot is annualized, as if the building were held for all of 2011. |
| (3) | Property subject to a ground lease. |
| (4) | Total rental income included in this table is straight-line rental income calculated in accordance with US GAAP. |
| (5) | Tenant has the option to terminate the lease in years 26-75. |
| (6) | Tenant has the option to terminate the lease in years 19-62. |
38
The following table summarizes the lease expirations by year for our properties for leases in place as of December 31, 2011:
| Year of Lease Expiration |
Square Feet | Number of Leases (1) |
Rental Revenue for Expiring Leases for the Year Ended December 31, 2011 (Dollars in Thousands) |
% of Annualized
Base Rent |
||||||||||||
| 2012 |
578,827 | 3 | 4,274 | 9.8 | % | |||||||||||
| 2013 |
364,262 | 5 | 3,690 | 8.5 | % | |||||||||||
| 2014 |
614,132 | 5 | 3,083 | 7.1 | % | |||||||||||
| 2015 |
896,876 | 8 | 6,823 | 15.7 | % | |||||||||||
| 2016 |
835,022 | 4 | 3,174 | 7.3 | % | |||||||||||
| 2017 |
102,200 | 1 | 922 | 2.1 | % | |||||||||||
| 2018 |
59,894 | 1 | 268 | 0.6 | % | |||||||||||
| 2019+ |
3,527,211 | 30 | 21,312 | 48.9 | % | |||||||||||
|
|
|
|
|
|
|
|
|
|||||||||
| Total |
6,978,424 | 57 | $ | 43,546 | 100 | % | ||||||||||
|
|
|
|
|
|
|
|
|
|||||||||
| (1) | Our two vacant buildings total 93,368 square feet. |
The following table summarizes the geographic locations of our properties for leases in place as of December 31, 2011:
| State |
Square Feet | Number of Leases (1) |
Rental Revenue for Expiring Leases for the Year Ended December 31, 2011 (Dollars in Thousands) |
% of Annualized
Base Rent |
||||||||||||
| Ohio |
1,185,411 | 11 | 7,455 | 17.1 | % | |||||||||||
| Minnesota |
547,800 | 3 | 5,078 | 11.7 | % | |||||||||||
| North Carolina |
695,876 | 6 | 3,828 | 8.8 | % | |||||||||||
| Pennsylvania |
623,375 | 4 | 3,039 | 7.0 | % | |||||||||||
| Texas |
188,178 | 4 | 2,438 | 5.6 | % | |||||||||||
| Michigan |
596,104 | 2 | 2,255 | 5.2 | % | |||||||||||
| Illinois |
164,131 | 2 | 2,067 | 4.7 | % | |||||||||||
| Massachusetts |
338,508 | 3 | 1,947 | 4.5 | % | |||||||||||
| All Other States |
2,639,041 | 22 | 15,439 | 35.4 | % | |||||||||||
|
|
|
|
|
|
|
|
|
|||||||||
| Total |
6,978,424 | 57 | $ | 43,546 | 100 | % | ||||||||||
|
|
|
|
|
|
|
|
|
|||||||||
| (1) | Our two vacant buildings total 93,368 square feet. |
We are not currently subject to any material legal proceedings, nor, to our knowledge, is any material legal proceeding threatened against us.
Item 4. Mine Safety Disclosures.
Not applicable.
39
PART II
Item 5. Market for Registrant’s Common Equity, Related Stockholder Matters and Issuer Purchases of Equity Securities.
Our common stock is traded on the NASDAQ Global Select Market, or NASDAQ, under the symbol “GOOD.” The following table reflects the range of the high and low sale prices of our common stock on NASDAQ and the distributions per share for the years ended December 31, 2011 and 2010. Distributions to stockholders are declared quarterly and paid monthly. Amounts presented represent the cumulative amount of the common stock distributions declared for the months composing such quarter.
| Market price per share | ||||||
| Quarter Ended |
High |
Low |
Distributions Declared Per Share | |||
| 3/31/2010 |
14.87 | 13.05 | 0.375 | |||
| 6/30/2010 |
17.79 | 14.36 | 0.375 | |||
| 9/30/2010 |
17.30 | 15.61 | 0.375 | |||
| 12/31/2010 |
19.50 | 17.00 | 0.375 | |||
| 3/31/2011 |
19.54 | 17.42 | 0.375 | |||
| 6/30/2011 |
19.43 | 16.88 | 0.375 | |||
| 9/30/2011 |
17.92 | 15.00 | 0.375 | |||
| 12/31/2011 |
17.76 | 13.93 | 0.375 | |||
Since inception, we have never reduced our per-share distributions nor have we missed payment of a scheduled distribution to our stockholders. Our Board of Directors regularly evaluates our per share distribution payments as they monitor the capital markets and the impact that the economy has upon us. The decision as to whether to authorize and pay distributions on shares of our common stock in the future, as well as the timing, amount and composition of any such future distributions, will be at the sole and absolute discretion of our Board of Directors in light of conditions then existing, including our earnings, taxable income, FFO, financial condition, liquidity, capital requirements, debt maturities, the availability of capital, contractual prohibitions or other restrictions, applicable REIT and legal restrictions and general overall economic conditions and other factors. While the statements above concerning our distribution policy represent our current expectations, any actual distribution payable will be determined by our Board of Directors based upon the circumstances at the time of declaration and the actual number of shares then outstanding, and any distribution payable may vary from such expected amounts.
To qualify as a REIT, we are required to make ordinary dividend distributions to our stockholders. The amount of these distributions must equal at least:
| • | the sum of (A) 90% of our “REIT taxable income” (computed without regard to the dividends paid deduction and capital gain) and (B) 90% of the net income (after tax), if any, from foreclosure property, less |
| • | the sum of certain non-cash items. |
For federal income tax purposes, our distributions generally consist of ordinary income, capital gains, nontaxable return of capital or a combination of those items. Distributions that exceed our current and accumulated earnings and profits (calculated for tax purposes) constitute a return of capital rather than a dividend, which reduces a stockholder’s basis in its shares of stock and will not be taxable to the extent of the stockholder’s basis in its shares of our stock. To the extent a distribution exceeds the stockholder’s share of both our current and accumulated earnings and profits and the stockholder’s basis in its shares of our stock, that distribution will be treated as a gain from the sale or exchange of that stockholder’s shares of our stock. Every year, we notify stockholders of the taxability of distributions paid to stockholders during the preceding year.
40
As of February 8, 2012, there were approximately 8,800 beneficial owners of our common stock.
On November 19, 2009, the Company entered into a dealer manager agreement, as amended and restated on December 22, 2009, or the Dealer Manager Agreement, with Halcyon Capital Markets, LLC, or Halcyon, pursuant to which Halcyon agreed to act as the Company’s dealer manager in connection with the Company’s continuous private offering of up to 3,333,333 shares of its then newly-designated unregistered senior common stock, par value $0.001 per share, at a price of $15.00 per share to investors and a selling commission of $1.6125 per share. On October 19, 2010, the Company terminated the private offering of unregistered senior common stock, including the related dividend reinvestment plan for such senior common stock. The Company issued 59,057 shares of unregistered senior common stock pursuant to the private offering and related dividend reinvestment plan. These issuances were exempt from registration pursuant to the Securities Act and to Rule 506 thereunder, among other exemptions, on the basis that the securities were sold in a private offering not involving general solicitation and that the purchasers of the securities were “accredited investors.” Net proceeds from these sales, after selling commissions and dealer manager fees, were approximately $787,000.
41
Item 6. Selected Financial Data.
The following selected financial data for the fiscal years ended December 31, 2011, 2010, 2009, 2008 and 2007 is derived from our audited consolidated financial statements. Certain amounts from prior years’ financial statements have been reclassified to discontinued operations and these reclassifications had no effect on previously reported net income or stockholders’ equity. The data should be read in conjunction with our consolidated financial statements and notes thereto, included elsewhere in this report, and “Management’s Discussion and Analysis of Financial Condition and Results of Operations” included in Item 7 of this report.
| For the year ended December 31, (Dollars in Thousands, Except Per Share Amounts) |
||||||||||||||||||||
| 2011 | 2010 | 2009 | 2008 | 2007 | ||||||||||||||||
| Operating Data: |
||||||||||||||||||||
| Total operating revenue |
$ | 43,976 | $ | 41,928 | $ | 42,609 | $ | 40,807 | $ | 32,690 | ||||||||||
| Total operating expenses |
(21,270 | ) | (23,414 | ) | (20,541 | ) | (19,364 | ) | (15,791 | ) | ||||||||||
| Other expense |
(16,992 | ) | (13,586 | ) | (17,668 | ) | (16,570 | ) | (10,941 | ) | ||||||||||
|
|
|
|
|
|
|
|
|
|
|
|||||||||||
| Income from continuing operations |
5,714 | 4,928 | 4,400 | 4,873 | 5,958 | |||||||||||||||
| Discontinued operations |
— | — | 203 | 40 | 182 | |||||||||||||||
|
|
|
|
|
|
|
|
|
|
|
|||||||||||
| Net income |
$ | 5,714 | $ | 4,928 | $ | 4,603 | $ | 4,913 | $ | 6,140 | ||||||||||
| Dividends attributable to preferred stock |
(4,094 | ) | (4,094 | ) | (4,094 | ) | (4,094 | ) | (4,094 | ) | ||||||||||
| Dividends attributable to senior common stock |
(62 | ) | (20 | ) | — | — | — | |||||||||||||
|
|
|
|
|
|
|
|
|
|
|
|||||||||||
| Net income available to common stockholders |
$ | 1,558 | $ | 814 | $ | 509 | $ | 819 | $ | 2,046 | ||||||||||
|
|
|
|
|
|
|
|
|
|
|
|||||||||||
| Share and Per Share Data: |
||||||||||||||||||||
| Earnings per weighted average common share - basic & diluted |
||||||||||||||||||||
| Income from continuing operations (net of dividends attributable to preferred stock) |
$ | 0.15 | $ | 0.09 | $ | 0.04 | $ | 0.09 | $ | 0.22 | ||||||||||
| Discontinued operations |
— | — | 0.02 | 0.01 | 0.02 | |||||||||||||||
|
|
|
|
|
|
|
|
|
|
|
|||||||||||
| Net income available to common stockholders |
$ | 0.15 | $ | 0.09 | $ | 0.06 | $ | 0.10 | $ | 0.24 | ||||||||||
|
|
|
|
|
|
|
|
|
|
|
|||||||||||
| Weighted average shares outstanding-basic |
10,237 | 8,576 | 8,563 | 8,565 | 8,565 | |||||||||||||||
| Weighted average shares outstanding-diluted |
10,289 | 8,601 | 8,563 | 8,565 | 8,565 | |||||||||||||||
| Cash dividends declared per common share |
$ | 1.50 | $ | 1.50 | $ | 1.50 | $ | 1.50 | $ | 1.44 | ||||||||||
| Supplemental Data: |
||||||||||||||||||||
| Net income available to common stockholders |
$ | 1,558 | $ | 814 | $ | 509 | $ | 819 | $ | 2,046 | ||||||||||
| Real estate depreciation and amortization, including discontinued operations |
14,149 | 13,264 | 13,172 | 12,705 | 10,528 | |||||||||||||||
| Less: Gain on sale of real estate, net of taxes paid |
— | — | (160 | ) | — | (78 | ) | |||||||||||||
|
|
|
|
|
|
|
|
|
|
|
|||||||||||
| Funds from operations available to common stockholders (1) |
15,707 | 14,078 | 13,521 | 13,524 | 12,496 | |||||||||||||||
|
|
|
|
|
|
|
|
|
|
|
|||||||||||
| Ratio of earnings to combined fixed charges and preferred dividends (2) |
1.1x | 1.0x | 1.0x | 1.0x | 1.1x | |||||||||||||||
| Balance Sheet Data: |
||||||||||||||||||||
| Real estate, before accumulated depreciation |
$ | 442,521 | $ | 401,017 | $ | 390,754 | $ | 390,562 | $ | 340,500 | ||||||||||
| Total assets |
$ | 453,147 | $ | 410,609 | $ | 416,865 | $ | 429,099 | $ | 378,903 | ||||||||||
| Mortgage notes payable, term loan and borrowings under the line of credit |
$ | 304,050 | $ | 286,595 | $ | 285,962 | $ | 286,611 | $ | 226,520 | ||||||||||
| Total stockholders’ equity |
$ | 135,314 | $ | 111,375 | $ | 118,451 | $ | 130,495 | $ | 142,368 | ||||||||||
| Total common shares outstanding |
10,945 | 8,725 | 8,563 | 8,565 | 8,565 | |||||||||||||||
| (1) | FFO was developed by The National Association of Real Estate Investment Trusts, or NAREIT, as a relative non- Generally Accepted Accounting Principles in the United States, or GAAP, supplemental measure of operating performance of an equity REIT in order to recognize that income-producing real estate historically has not depreciated on the basis determined under GAAP. FFO, as defined by NAREIT, is net income (loss) (computed in accordance with GAAP), excluding gains (or losses) from sales of property, plus depreciation and amortization of real estate assets, and after adjustments for unconsolidated partnerships and joint ventures. FFO does not represent cash flows from operating activities in accordance with GAAP and should not be considered an alternative to either net income (loss) as an indication of our performance or to cash flow from operations as a measure of liquidity or ability to make distributions to stockholders. Comparison of FFO to similarly titled measures for other REITs may not necessarily be meaningful due to possible differences in the application of the NAREIT definition used by such REITs. |
FFO available to common stockholders is FFO adjusted to subtract preferred share and senior common share distributions. We believe that net income available to common stockholders is the most directly comparable GAAP measure to FFO available to common stockholders.
Basic funds from operations per share, or Basic FFO per share, and diluted funds from operations per share, or Diluted FFO per share, is FFO available to common stockholders divided by weighted average common shares outstanding and FFO available to common stockholders divided by weighted average common shares outstanding on a diluted basis, respectively, during a period. We believe that FFO available to common stockholders, Basic FFO per share and Diluted FFO per share are useful to investors because they provide investors with a further context for evaluating our FFO results in the same manner that investors use net income and earnings per share, or EPS, in evaluating net income available to common stockholders. In addition, since most REITs provide FFO available to common stockholders,
42
Basic FFO and Diluted FFO per share information to the investment community, we believe these are useful supplemental measures for comparing us to other REITs. We believe that net income is the most directly comparable GAAP measure to FFO, Basic EPS is the most directly comparable GAAP measure to Basic FFO per share, and that diluted EPS is the most directly comparable GAAP measure to Diluted FFO per share.
The following table provides a reconciliation of our FFO for the years ended December 31, 2011, 2010, 2009, 2008 and 2007 to the most directly comparable GAAP measure, net income, and a computation of basic and diluted FFO per weighted average common share and basic and diluted net income per weighted average common share:
| For the year ended December 31, (Dollars in Thousands, Except Per Share Amounts) |
||||||||||||||||||||
| 2011 | 2010 | 2009 | 2008 | 2007 | ||||||||||||||||
| Net income |
$ | 5,714 | $ | 4,928 | $ | 4,603 | $ | 4,913 | $ | 6,140 | ||||||||||
| Less: Distributions attributable to preferred and senior common stock |
(4,156 | ) | (4,114 | ) | (4,094 | ) | (4,094 | ) | (4,093 | ) | ||||||||||
|
|
|
|
|
|
|
|
|
|
|
|||||||||||
| Net income available to common stockholders |
1,558 | 814 | 509 | 819 | 2,047 | |||||||||||||||
| Add: Real estate depreciation and amortization, including discontinued operations |
14,149 | 13,264 | 13,172 | 12,705 | 10,528 | |||||||||||||||
| Less: Gain on sale of real estate |
— | — | (160 | ) | — | (79 | ) | |||||||||||||
|
|
|
|
|
|
|
|
|
|
|
|||||||||||
| FFO available to common stockholders |
$ | 15,707 | $ | 14,078 | $ | 13,521 | $ | 13,524 | $ | 12,496 | ||||||||||
| Weighted average shares outstanding - basic |
10,237 | 8,576 | 8,563 | 8,565 | 8,565 | |||||||||||||||
| Weighted average shares outstanding - diluted |
10,289 | 8,601 | 8,563 | 8,565 | 8,565 | |||||||||||||||
| Basic & Diluted net income per weighted average share of common stock |
$ | 0.15 | $ | 0.09 | $ | 0.06 | $ | 0.10 | $ | 0.24 | ||||||||||
|
|
|
|
|
|
|
|
|
|
|
|||||||||||
| Basic & Diluted FFO per weighted average share of common stock |
$ | 1.53 | $ | 1.64 | $ | 1.58 | $ | 1.58 | $ | 1.46 | ||||||||||
|
|
|
|
|
|
|
|
|
|
|
|||||||||||
| Distributions declared per share of common stock |
$ | 1.50 | $ | 1.50 | $ | 1.50 | $ | 1.50 | $ | 1.44 | ||||||||||
|
|
|
|
|
|
|
|
|
|
|
|||||||||||
| Percentage of FFO paid per share of common stock |
98 | % | 91 | % | 95 | % | 95 | % | 99 | % | ||||||||||
|
|
|
|
|
|
|
|
|
|
|
|||||||||||
| (2) | The calculation of the ratio of earnings to combined fixed charges and preferred distributions is below. “Earnings” consist of net income from continuing operations before fixed charges. “Fixed charges” consist of interest expense, amortization of deferred financing fees and the portion of operating lease expense that represents interest. The portion of operating lease expense that represents interest is calculated by dividing the amount of rent expense, allocated to us by our Adviser as part of the administration fee payable under the Advisory Agreement, by three. |
| For the year ended December 31, (Dollars in Thousands, Except Ratios) |
||||||||||||||||||||
| 2011 | 2010 | 2009 | 2008 | 2007 | ||||||||||||||||
| Net income from continuing operations |
$ | 5,714 | $ | 4,928 | $ | 4,400 | $ | 4,873 | $ | 5,958 | ||||||||||
| Add: fixed charges |
21,247 | 21,191 | 22,001 | 20,964 | 15,670 | |||||||||||||||
| Less: preferred and senior common distributions |
(4,156 | ) | (4,114 | ) | (4,094 | ) | (4,094 | ) | (4,094 | ) | ||||||||||
|
|
|
|
|
|
|
|
|
|
|
|||||||||||
| Earnings |
$ | 22,805 | $ | 22,005 | $ | 22,307 | $ | 21,743 | $ | 17,534 | ||||||||||
| Fixed Charges: |
||||||||||||||||||||
| Interest expense |
16,158 | 16,031 | 16,399 | 15,575 | 10,847 | |||||||||||||||
| Amortization of deferred financing fees |
918 | 1,031 | 1,496 | 1,284 | 717 | |||||||||||||||
| Estimated interest component of rent |
15 | 15 | 12 | 11 | 12 | |||||||||||||||
| Preferred and senior common distributions |
4,156 | 4,114 | 4,094 | 4,094 | 4,094 | |||||||||||||||
|
|
|
|
|
|
|
|
|
|
|
|||||||||||
| Total fixed charges and preferred distributions |
21,247 | 21,191 | 22,001 | 20,964 | 15,670 | |||||||||||||||
| Ratio of earnings to combined fixed charges and preferred distributions |
1.1 | 1.0 | 1.0 | 1.0 | 1.1 | |||||||||||||||
43
Item 7. Management’s Discussion and Analysis of Financial Condition and Results of Operations
The following analysis of our financial condition and results of operations should be read in conjunction with our financial statements and the notes thereto contained elsewhere in this Form 10-K.
OVERVIEW
General
We are a real estate investment trust, or REIT, that was incorporated under the General Corporation Law of the State of Maryland on February 14, 2003, primarily for the purpose of investing in and owning net leased industrial, commercial and retail real property and selectively making long-term industrial and commercial mortgage loans. Our portfolio of real estate is leased to a wide cross section of tenants ranging from small businesses to large public companies, many of which are corporations that do not have publicly-rated debt. We have historically entered into, and intend in the future to enter into, purchase agreements for real estate having triple net leases with terms of approximately 10 to 15 years and built in rental rate increases. Under a triple net lease, the tenant is required to pay all operating, maintenance and insurance costs and real estate taxes with respect to the leased property. We are actively communicating with buyout funds, real estate brokers and other third parties to locate properties for potential acquisition or to provide mortgage financing in an effort to build our portfolio. We currently own 73 properties totaling 7.1 million square feet, which have a total gross and net carrying value, including intangible assets, of $513.7 million and $437.2 million, respectively. We do not currently have any mortgage loans outstanding.
Business Environment
The United States continues to feel the lingering impact of the recession that began in late 2007; unemployment remains high, housing starts are low and the economic situation in Europe will need to improve for the economy to fully recover. As a result, conditions within the U.S. capital markets generally, and the U.S. real estate capital markets particularly, continue to experience significant dislocation and stress. While we are seeing signs of improvement in both the equity and debt capital markets, these markets remain somewhat challenging. Despite the challenges in the marketplace, we were able to issue 2.2 million common shares during 2011 for gross proceeds of $39.4 million. In addition, in January 2012 we closed on $38.5 million of Series C Cumulative Term Preferred stock, or Term Preferred Stock, which is redeemable in five years. During 2011, we also assumed or issued $31.7 million in mid-term mortgages to finance some of our new properties.
However, these economic conditions could still materially and adversely impact the financial condition of one or more of our tenants and, therefore, could increase the likelihood that a tenant may declare bankruptcy or default upon its payment obligations arising under a related lease. For example, the tenant occupying our building located in Hazelwood, Missouri declared bankruptcy in October 2010. The tenant did not confirm our lease in its bankruptcy proceedings in March 2011, and the final rent payment was received in April 2011. We are currently working to re-tenant this property. In addition, our building located in Richmond, Virginia remains vacant. The leases on these two vacant buildings comprised 2.3% of our annualized rental income and the annual carrying costs are $177,000. We are actively seeking new tenants for these properties. All of our remaining properties are occupied and the tenants are paying in accordance with their leases.
Moreover, our ability to make new investments is highly dependent upon our ability to procure external financing. Our principal sources of external financing generally include the issuance of equity securities, long-term mortgage loans secured by properties and borrowings under our line of credit, or the Line of Credit. The market for long-term mortgages has been limited for some time; however, we have recently seen mid-to-long-term (5 to 10 year) mortgages become more obtainable. The collateralized mortgage backed securities, or CMBS, market has been attempting to make a comeback in recent months, but it is much more conservative than it was prior to the recession and the pricing in the market remains volatile. As a result, we will likely not have the same level of access to the CMBS market that we had prior to the recession. Consequently, we are looking to regional banks, insurance companies and other non-bank lenders, and, to a lesser extent, the CMBS market to issue mortgages to finance our real estate activities.
44
Recent Developments
Investment Activities
The following is a summary of our recent acquisitions:
Hickory, North Carolina: On April 4, 2011, we acquired a 60,000 square foot office building located in Hickory, North Carolina for $10.7 million, excluding related acquisition expenses of $59,000. We funded this acquisition using borrowings from our Line of Credit. At closing, we were assigned the existing triple net lease with the existing tenant, which has a remaining term of approximately nine years. The tenant has two options to extend the lease for additional periods of five years each. The lease provides for prescribed rent escalations over the life of the lease, with annualized straight line rents of $1.1 million.
Springfield, Missouri: On June 20, 2011, we acquired a 78,421 square foot office building located in Springfield, Missouri for $15.9 million, excluding related acquisition expenses of $55,000. We funded this acquisition through a combination of borrowings from our Line of Credit and the assumption of approximately $11.6 million of mortgage debt on the property. At closing, we were assigned the existing triple net lease with T-Mobile USA, Inc., which has a remaining term of approximately ten years. The tenant has three options to extend the lease for additional periods of five years each. The lease provides for prescribed rent escalations over the life of the lease, with annualized straight line rents of $1.4 million.
Boston Heights, Ohio: On October 20, 2011, we acquired a 25,000 square foot office building located in Boston Heights, Ohio for $4.4 million, excluding related acquisition expenses of $56,000. We funded this acquisition using borrowings from our Line of Credit. The property was a new build-to-suit for Paychex North America, a subsidiary of Paychex, Inc. The tenant has leased the property for ten years and has three options to renew the lease for additional periods of three years each. The lease provides for prescribed rent escalations over the life of the lease, with annualized straight line rents of $377,000.
Parsippany, New Jersey: On October 28, 2011, we acquired a 60,111 square foot office building located in Parsippany, New Jersey for $11.1 million, excluding related acquisition expenses of $390,000. We funded this acquisition through a combination of borrowings from our Line of Credit and the issuance of $7.2 million of mortgage debt on the property. The tenant has leased the property for 15 years and has one option to renew the lease for an additional period of three years. The lease provides for prescribed rent escalations over the life of the lease, with annualized straight line rents of $1.1 million.
Dartmouth, Massachusetts: On November 18, 2011, we acquired the leasehold interests in a 16,340 square foot retail building located in Dartmouth, Massachusetts for $5.8 million, excluding related acquisition expenses of $56,000. We funded this acquisition through a combination of borrowings from our Line of Credit and the issuance of $4.4 million of mortgage debt on the property. The property was a new build-to-suit and is primarily leased to the Walgreens Company. Walgreens has leased the property for 75 years with the rights to terminate every 5 years in years 26-75. The lease provides for prescribed rent escalations over the life of the lease with annualized straight line rents, net of ground lease payments, of $414,000.
Springfield, Missouri: On December 13, 2011, we acquired the leasehold interests in a 14,560 square foot retail building located in Springfield, Missouri for $2.7 million, excluding related acquisition expenses of $42,000. We funded this acquisition using borrowings from our Line of Credit. The property is leased to the Walgreens Company. Walgreens has 62 years remaining on the lease with the rights to terminate every 5 years in years 19-62. The lease provides for prescribed rent escalations over the life of the lease with annualized straight line rents, net of ground lease payments, of $221,000.
45
Pittsburgh, Pennsylvania: On December 28, 2011, we acquired a 26,080 square foot office building located in Pittsburgh, Pennsylvania for $4.2 million, excluding related acquisition expenses of $140,000. We funded this acquisition using borrowings from our Line of Credit. Expedient Communications, a data center operator, is the tenant in this building and has leased the property for 15 years and has 2 options to renew the lease for additional periods of 5 years each. The lease provides for prescribed rent escalations over the life of the lease, with annualized straight line rents of $400,000.
Ashburn, Virginia: On January 25, 2012, we acquired a 52,130 square foot office building located in Ashburn, Virginia for $10.8 million, excluding related acquisition expenses of $98,000. We funded this acquisition using borrowings from our Line of Credit. Independent Project Analysis, Inc, an energy consultant, is the tenant in this building and has leased the property for 15 years and has 2 options to renew the lease for additional periods of 5 years each. The lease provides for prescribed rent escalations over the life of the lease, with annualized straight line rents of $989,000.
Financing Activities
Debt
The following is a summary of debt that has recently been issued:
PNC Bank: On June 20, 2011, we assumed approximately $11.6 million of indebtedness pursuant to a long-term note payable from PNC Bank, in connection with the Company’s acquisition, on the same date, of a property located in Springfield, Missouri. The note accrues interest at a rate of 6.08% per year, and we may not repay this note prior to the last two months of the term, or we would be subject to a substantial prepayment penalty. The note matures on June 30, 2016.
Provident Bank: On October 28, 2011, we borrowed $7.2 million pursuant to a long-term note payable from The Provident Bank, which is collateralized by a security interest in our Parsippany, New Jersey property, which was acquired on the same date. The note accrues interest at a rate of 6.00% per year and we may not repay this note prior to the last two years of the term, or we would be subject to a substantial prepayment penalty. The note has a maturity date of November 1, 2021.
Liberty Bank: On November 18, 2011, we borrowed $4.4 million pursuant to a long-term note payable from Liberty Bank, which is collateralized by a security interest in our Dartmouth, Massachusetts property, which was acquired on the same date. The note accrues interest at a rate of 4.50% per year and we may not repay this note prior to the last three months of the term, or we would be subject to a substantial prepayment penalty. The note has a maturity date of November 1, 2018, with a three year extension period through November 1, 2021.
Great Southern Bank: On December 6, 2011, we borrowed $8.5 million pursuant to a long-term note payable from Great Southern Bank, which is collateralized by a security interest in our Tulsa, Oklahoma property. The note accrues interest for the first five years at a rate of 6.00% per year, after the 5th year the rate is based on the prime rate, with a floor of 6.00%. We may not repay this note prior to December 6, 2015, or we would be subject to a substantial prepayment penalty. The note has a maturity date of December 6, 2019.
Line of Credit
Expansion: On January 31, 2012, we amended our Line of Credit to increase the current maximum availability of credit under our Line of Credit from $50.0 million to $75.0 million. The Line of Credit was arranged by Capital One, N.A. as administrative agent, and Branch Banking and Trust Company as an additional lender. Citizens Bank of Pennsylvania joined the Line of Credit as an additional lender. All other terms of the agreement remained the same.
46
Leasing Activities
The following is a summary of leases that have been recently extended:
Georgia Properties: On January 31, 2011, we extended the lease with our tenant occupying our properties located in Decatur, Georgia, Lawrenceville, Georgia, Snellville, Georgia, Covington, Georgia, and Conyers, Georgia. The lease covering all of these properties was extended for an additional five year period, thereby extending the lease until December 2031. The lease was originally set to expire in December 2026. The lease provides for prescribed rent escalations over the life of the lease, with annualized straight line rents of $1.6 million. Furthermore, the lease grants the tenant four options to extend the lease for a period of five years each. In connection with the extension of the lease and the modification of certain terms under the lease, the tenant paid $750,000.
South Hadley, Massachusetts: On May 15, 2011, we re-leased our previously vacant building located in South Hadley, Massachusetts for a period of six months, with a three-month extension option. In February 2012, the tenant signed a new lease with a term expiring in January 2013, with a one-year extension option.
Angola, Indiana: On June 23, 2011, we extended the lease with the tenant occupying our properties located in Angola, Indiana and Rock Falls, Illinois. The lease covering these properties was extended for an additional three-year period, thereby extending the lease until August 2023. The lease was originally set to expire in August 2020. The lease provides for prescribed rent escalations over the life of the lease, with annualized straight line rents of approximately $345,000. Furthermore, the lease grants the tenant three options to extend the lease for a period of five years each. In connection with the extension of the lease and the modification of certain terms under the lease, we provided a tenant allowance of $150,000, payable over a one year period.
San Antonio, Texas: On February 14, 2012, we extended the lease with the tenant occupying our property located in San Antonio, Texas. The lease covering this property was extended for an additional eight-year period, thereby extending the lease until November 2021. The lease was originally set to expire in February 2014. The lease provides for prescribed rent escalations over the life of the lease, with annualized straight line rents of approximately $785,000. Furthermore, the lease grants the tenant two options to extend the lease for a period of five years each. In connection with the extension of the lease and the modification of certain terms under the lease, we provided a tenant allowance of $603,000, payable over two years, and paid $327,000 in leasing commissions.
Roseville, Minnesota: On February 27, 2012, we extended the lease with the tenant occupying our property located in Roseville, Minnesota. The new lease covers approximately one-third of this property and was extended for an additional five year period, thereby extending the lease until December 2017. The lease was originally set to expire in December 2012. The tenant in this property will pay rent on the entire building through the end of 2012, and we continue to search for new tenants to lease the remainder of the building. The new lease provides for prescribed rent escalations over the life of the lease, with annualized straight line rents of $1,257. Furthermore, the lease grants the tenant one option to extend the lease for a period of five years. In connection with the extension of the lease and the modification of certain terms under the lease, we provided a tenant allowance of $413, payable over two years, and paid $767 in leasing commissions.
Equity Activities
The equity issuances summarized below were all issued under our effective shelf registration statement on file with the Securities and Exchange Commission, or SEC.
Common Equity: On February 2, 2011, we closed on the sale of 725,000 shares of our common stock at $18.35 per share in an underwritten public offering. Subsequently, on February 16, 2011, we closed on the sale of an additional 108,750 shares of common stock on the same terms and conditions in connection with the underwriters’ exercise of their over-allotment option. The net proceeds, including the over-allotment, after deducting the underwriting discount and offering expenses were $14.3 million. We used the proceeds of the offering to repay a portion of the outstanding balance under our Line of Credit and for general corporate purposes.
Common Equity: On June 15, 2011, we closed on the sale of 1,200,000 shares of our common stock at $17.55 per share in an underwritten public offering. Subsequently, on July 6, 2011, we closed on the sale of an additional 174,000 shares of common stock on the same terms and conditions in connection
47
with the underwriters’ exercise of their over-allotment option. The net proceeds, including the over-allotment, after deducting the underwriting discount and offering expenses were $22.7 million. We used the proceeds of the offering to repay a portion of the outstanding balance under our Line of Credit and for general corporate purposes.
Preferred Equity: On February 1, 2012, we completed a public offering of 1.4 million shares of 7.125% Series C Term Preferred Stock, par value $0.001 per share, at a public offering price of $25.00 per share. Gross proceeds totaled $35.0 million and net proceeds of the offering, after deducting underwriting discounts and offering expenses borne by us, were $33.4 million and were used to repay a portion of outstanding borrowings under our Line of Credit and for acquistions of real estate. On February 8, 2012, the underwriters notified us of their intent to exercise their option to purchase an additional 140,000 shares of the Term Preferred Stock to cover over-allotments, which resulted in net proceeds, after deducting underwriting discounts, of $3.4 million received by us on February 10, 2012, which were used for working capital. The shares are traded under the ticker symbol GOODN on the NASDAQ. The Term Preferred Stock is not convertible into our common stock or any other security. Generally, we may not redeem shares of the Term Preferred Stock prior to January 31, 2016, except in limited circumstances to preserve our status as a REIT. On or after January 31, 2016, we may redeem the shares at a redemption price of $25 per share, plus any accumulated and unpaid dividends to and including the date of redemption. The shares of the Term Preferred Stock have a mandatory redemption date of January 31, 2017. In accordance with ASC 480, “Distinguishing Liabilities from Equity,” mandatorily redeemable financial instruments should be classified as liabilities in the balance sheet and therefore we will record the Term Preferred Stock as a liability.
Senior Common Equity: During December 2011 and January 2012, we issued 11,933 shares of our senior common stock at $15.00 per share in an ongoing best-efforts public offering. The net proceeds, after deducting the underwriting discount and commission were $161,100. We used the proceeds of the offering to repay a portion of the outstanding balance under our Line of Credit and for general corporate purposes.
48
Diversity of Our Portfolio
Gladstone Management Corporation, or our Adviser, seeks to diversify our portfolio to avoid dependence on any one particular tenant, geographic market or tenant industry. By diversifying our portfolio, our Adviser intends to reduce the adverse effect on our portfolio of a single under-performing investment or a downturn in any particular industry or geographic market. Our largest tenant at December 31, 2011 comprised 6.9% of our total rental income, and our largest concentration of properties was located in Ohio, which accounted for 17.1% of our total rental income. The table below reflects the breakdown of our total rental income by tenant industry classification for the years ended December 31, 2011 and 2010, respectively:
| For the year ended December 31, 2011 | For the year ended December 31, 2010 | For the year ended December 31, 2009 | ||||||||||||||||||||||
| (Dollars in Thousands) | (Dollars in Thousands) | (Dollars in Thousands) | ||||||||||||||||||||||
| Industry Classification |
Rental Income | Percentage of Rental Income |
Rental Income | Percentage of Rental Income |
Rental Income | Percentage of Rental Income |
||||||||||||||||||
| Healthcare, Education & Childcare |
$ | 6,467 | 14.7 | % | $ | 6,145 | 14.9 | % | $ | 6,145 | 14.8 | % | ||||||||||||
| Telecommunications |
6,206 | 14.2 | 5,447 | 13.3 | 5,447 | 13.0 | ||||||||||||||||||
| Electronics |
6,046 | 13.9 | 6,165 | 15.0 | 6,165 | 14.9 | ||||||||||||||||||
| Diversified/Conglomerate Manufacturing |
3,664 | 8.4 | 3,665 | 8.9 | 3,664 | 8.8 | ||||||||||||||||||
| Chemicals, Plastics & Rubber |
3,146 | 7.2 | 3,130 | 7.6 | 3,173 | 7.6 | ||||||||||||||||||
| Containers, Packaging & Glass |
2,339 | 5.4 | 2,330 | 5.7 | 2,330 | 5.6 | ||||||||||||||||||
| Personal & Non-Durable Consumer Products |
2,316 | 5.3 | 1,228 | 3.0 | 1,355 | 3.3 | ||||||||||||||||||
| Beverage, Food & Tobacco |
2,271 | 5.2 | 2,189 | 5.3 | 2,189 | 5.3 | ||||||||||||||||||
| Machinery |
2,256 | 5.2 | 2,333 | 5.7 | 2,390 | 5.8 | ||||||||||||||||||
| Buildings and Real Estate |
2,120 | 4.9 | 2,075 | 5.0 | 2,026 | 4.9 | ||||||||||||||||||
| Printing & Publishing |
1,979 | 4.5 | 2,188 | 5.3 | 2,189 | 5.3 | ||||||||||||||||||
| Oil & Gas |
1,271 | 2.9 | 1,283 | 3.1 | 1,138 | 2.7 | ||||||||||||||||||
| Automobile |
1,167 | 2.7 | 1,167 | 2.8 | 1,167 | 2.8 | ||||||||||||||||||
| Diversified/Conglomerate Services |
1,001 | 2.3 | 308 | 0.7 | 308 | 0.8 | ||||||||||||||||||
| Personal, Food & Miscellaneous Services |
649 | 1.5 | 575 | 1.4 | 575 | 1.4 | ||||||||||||||||||
| Home & Office Furnishings |
530 | 1.2 | 530 | 1.3 | 530 | 1.3 | ||||||||||||||||||
| Banking |
204 | 0.5 | — | 0.0 | — | 0.0 | ||||||||||||||||||
| Insurance |
— | 0.0 | 422 | 1.0 | 723 | 1.7 | ||||||||||||||||||
|
|
|
|
|
|
|
|
|
|
|
|
|
|||||||||||||
| $ | 43,632 | 100.0 | % | $ | 41,180 | 100.0 | % | $ | 41,514 | 100.0 | % | |||||||||||||
|
|
|
|
|
|
|
|
|
|
|
|
|
|||||||||||||
Our Adviser and Administrator
Our Adviser is led by a management team which has extensive experience purchasing real estate and originating mortgage loans. Our Adviser is controlled by Mr. David Gladstone, our chairman and chief executive officer. Mr. Gladstone is also the chairman and chief executive officer of our Adviser. Terry Lee Brubaker, our vice chairman, chief operating officer, secretary and director, is a member of the Board of Directors of our Adviser as well as its vice chairman and chief operating officer. George Stelljes III, our president, chief investment officer and director, is a member of the Board of Directors of our Adviser and its president and chief investment officer. Gladstone Administration, LLC, or our Administrator, employs our chief financial officer, chief compliance officer, internal counsel, treasurer, investor relations department and their respective staffs.
Our Adviser and Administrator also provide investment advisory and administrative services, respectively, to our affiliates, including, but not limited to, Gladstone Capital Corporation and Gladstone Investment Corporation, both publicly-traded business development companies, as well as Gladstone Land Corporation, a private agricultural real estate company. With the exception of our chief financial officer, all of our executive officers serve as either directors or executive officers, or both, of Gladstone Capital Corporation and Gladstone Investment Corporation. In the future, our Adviser may provide investment advisory services to other funds, both public and private, of which it is the sponsor.
Advisory and Administration Agreements
We are externally managed pursuant to contractual arrangements with our Adviser and our Administrator. Our Adviser and Administrator employ all of our personnel and pay their payroll, benefits, and general expenses directly. We have an advisory agreement with our Adviser, or the Advisory Agreement, and an administration agreement with our Administrator, or the Administration Agreement.
Under the terms of the Advisory Agreement, we are responsible for all expenses incurred for our direct benefit. Examples of these expenses include legal, accounting, interest on short-term debt and mortgages, tax preparation, directors’ and officers’ insurance, stock transfer services, stockholder-related fees, consulting and related fees. In addition, we are also responsible for all fees charged by third parties that are directly related to our business, which may include real estate brokerage fees, mortgage placement fees, lease-up fees and transaction structuring fees (although we may be able to pass some or all of such fees on to our tenants and borrowers).
During the years ended December 31, 2011, 2010 and 2009, none of these third party expenses were incurred by us directly. The actual amount of such fees that we incur in the future will depend largely upon the aggregate costs of the properties that we acquire, the aggregate amount of mortgage loans that we make and the extent to which we are able to pass on such fees to our tenants and borrowers pursuant to the terms of the agreements. Accordingly, the amount of these fees that we will pay in the future is not determinable at this time.
49
Management Services and Fees under the Advisory Agreement
The Advisory Agreement provides for an annual base management fee equal to 2.0% of our total stockholders’ equity, less the recorded value of any preferred stock, or total common stockholders’ equity, and for an incentive fee based on funds from operations, or FFO. Our Adviser does not charge acquisition or disposition fees when we acquire or dispose of properties as is common with other externally-advised REITs. Furthermore, there are no fees charged when our Adviser secures long or short term credit or arranges mortgage loans on our properties, however, our Adviser may earn fee income from our borrowers or tenants or other sources.
For purposes of calculating the incentive fee, FFO includes any realized capital gains and capital losses, less any distributions paid on preferred stock and senior common stock, but FFO does not include any unrealized capital gains or losses. The incentive fee would reward our Adviser if our quarterly FFO, before giving effect to any incentive fee, or pre-incentive fee FFO, exceeds 1.75%, or the hurdle rate, of total common stockholders’ equity. We pay our Adviser an incentive fee with respect to our pre-incentive fee FFO in each calendar quarter as follows:
| • | no incentive fee in any calendar quarter in which our pre-incentive fee FFO does not exceed the hurdle rate of 1.75% (7% annualized); |
| • | 100% of the amount of the pre-incentive fee FFO that exceeds the hurdle rate, but is less than 2.1875% in any calendar quarter (8.75% annualized); and |
| • | 20% of the amount of our pre-incentive fee FFO that exceeds 2.1875% in any calendar quarter (8.75% annualized). |
Quarterly Incentive Fee Based on FFO
Pre-incentive fee FFO
(expressed as a percentage of total common stockholders’ equity)
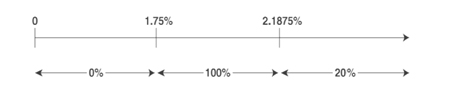
Percentage of pre-incentive fee FFO allocated to the incentive fee
The incentive fee may be reduced because of a covenant which exists in our Line of Credit agreement which limits distributions to our stockholders to 95% of FFO less those acquisition-related costs that are required to be expensed under Accounting Standards Codification, or ASC, 805, Business Combinations. In order to comply with this covenant, our Board of Directors accepted our Adviser’s offer to unconditionally, irrevocably and voluntarily waive on a quarterly basis a portion of the incentive fee for the years ended December 31, 2011, 2010 and 2009, which allowed us to maintain the current level of distributions to our stockholders. These waived fees may not be recouped by our Adviser in the future. Our Adviser has indicated that it intends to continue to waive all or a portion of the incentive fee in order to support the current level of distributions to our stockholders; however, our Adviser is not required to issue any such waiver, either in whole or in part.
50
Administration Agreement
Pursuant to the Administration Agreement, we pay for our allocable portion of our Administrator’s overhead expenses incurred while performing its obligations to us, including, but not limited to, rent and the salaries and benefits expenses of our personnel, including our chief financial officer, chief compliance officer, internal counsel, treasurer, investor relations department and their respective staffs. Our allocable portion of expenses is generally derived by multiplying our Administrator’s total expenses by the percentage of our total assets at the beginning of each quarter in comparison to the total assets of all companies managed by our Adviser under similar agreements.
Critical Accounting Policies
The preparation of our financial statements in accordance with generally accepted accounting principles in the United States of America, or GAAP, requires management to make judgments that are subjective in nature in order to make certain estimates and assumptions. Our Adviser relies on its experience, collects historical and current market data and analyzes this information in order to arrive at what it believes to be reasonable estimates. Under different conditions or assumptions, materially different amounts could be reported related to the accounting policies described below. In addition, application of these accounting policies involves the exercise of judgment regarding the use of assumptions as to future uncertainties, and as a result, actual results could materially differ from these estimates. A summary of all of our significant accounting policies is provided in Note 1 to our consolidated financial statements included elsewhere in this Form 10-K. Below is a summary of accounting polices involving estimates and assumptions that require complex, subjective or significant judgments in their application and that materially affect our results of operations.
Allocation of Purchase Price
When we acquire real estate, we allocate the purchase price, less any expenses related to the acquisition, to (i) the acquired tangible assets and liabilities, consisting of land, building, tenant improvements, long-term debt and (ii) the identified intangible assets and liabilities, consisting of the value of above-market and below-market leases, in-place leases, unamortized lease origination costs, tenant relationships and capital lease obligations, based in each case on their fair values. All expenses related to the acquisition are expensed as incurred, rather than capitalized into the cost of the acquisition as had been required by the previous accounting.
Management’s estimates of value are made using methods similar to those used by independent appraisers (e.g., discounted cash flow analysis). Factors considered by management in its analysis include an estimate of carrying costs during hypothetical expected lease-up periods, considering current market conditions and costs to execute similar leases. We also consider information obtained about each property as a result of our pre-acquisition due diligence, marketing and leasing activities in estimating the fair value of the tangible and intangible assets and liabilities acquired. In estimating carrying costs, management also includes real estate taxes, insurance and other operating expenses and estimates of lost rentals at market rates during the hypothetical expected lease-up periods, which primarily range from 9 to 18 months, depending on specific local market conditions. Management also estimates costs to execute similar leases, including leasing commissions, legal and other related expenses to the extent that such costs are not already incurred in connection with a new lease origination as part of the transaction. Management also considers the nature and extent of our existing business relationships with the tenant, growth prospects for developing new business with the tenant, the tenant’s credit quality and management’s expectations of lease renewals (including those existing under the terms of the lease agreement), among other factors. A change in any of the assumptions above, which are very subjective, could have a material impact on our results of operations.
51
The allocation of the purchase price directly affects the following in our consolidated financial statements:
| • | The amount of purchase price allocated to the various tangible and intangible assets on our balance sheet; |
| • | The amounts allocated to the value of above-market and below-market lease values are amortized to rental income over the remaining non-cancelable terms of the respective leases. The amounts allocated to all other tangible and intangible assets are amortized to depreciation or amortization expense. Thus, depending on the amounts allocated between land and other depreciable assets, changes in the purchase price allocation among our assets could have a material impact on our FFO, a metric which is used by many REIT investors to evaluate our operating performance; and |
| • | The period of time over which tangible and intangible assets are depreciated varies greatly, and thus, changes in the amounts allocated to these assets will have a direct impact on our results of operations. Intangible assets are generally amortized over the respective life of the leases, which normally range from 10 to 15 years. Also, we depreciate our buildings over 39 years, but do not depreciate our land. These differences in timing could have a material impact on our results of operations. |
Asset Impairment Evaluation
We periodically review the carrying value of each property to determine if circumstances that indicate impairment in the carrying value of the investment exist or that depreciation periods should be modified. In determining if impairment exists, management considers such factors as our tenants’ payment histories, the financial condition of our tenants, including calculating the current leverage ratios of tenants, the likelihood of lease renewal, business conditions in the industries in which our tenants operate and whether the carrying value of our real estate has decreased. If any of the factors above support the possibility of impairment, we prepare a projection of the undiscounted future cash flows, without interest charges, of the specific property and determine if the carrying amount of such property is recoverable. In preparing the projection of undiscounted future cash flows, we estimate the holding periods of the properties and cap rates using information that we obtain from market comparability studies and other comparable sources. If impairment were indicated, the carrying value of the property would be written down to its estimated fair value based on our best estimate of the property’s discounted future cash flows using assumptions from market participants. Any material changes to the estimates and assumptions used in this analysis could have a significant impact on our results of operations, as the changes would impact our determination of whether impairment is deemed to have occurred and the amount of impairment loss that we would recognize.
Using the methodology discussed above and in light of the current economic conditions discussed above in “Overview—Business Environment,” we evaluated our entire portfolio as of December 31, 2011 for any impairment indicators and performed an impairment analysis on those select properties that had an indication of impairment. As a result of this analysis, we concluded that none of our properties were impaired and we will continue to monitor our portfolio for any indicators that may change our conclusion.
Results of Operations
The weighted-average yield on our total portfolio, taking into account vacant properties, was 9.4% as of December 31, 2011. If all properties in the portfolio were fully occupied, the weighted-average yield would have been 9.5%, assuming returns on our vacant buildings remained steady, as of December 31, 2011. The weighted-average yield on our portfolio is calculated by taking the annualized straight-line rents, reflected as rental income on our consolidated statements of operations, of each acquisition as a percentage of the acquisition. The weighted-average yield does not account for the interest expense incurred on the mortgages placed on our properties.
52
A comparison of our operating results for the years ended December 31, 2011 and 2010 is below:
| For the year ended December 31, | ||||||||||||||||
| 2011 | 2010 | $ Change | % Change | |||||||||||||
| (Dollars in Thousands) | ||||||||||||||||
| Operating revenues |
||||||||||||||||
| Rental income |
$ | 43,632 | $ | 41,180 | $ | 2,452 | 6 | % | ||||||||
| Interest income from mortgage note receivable |
— | 421 | (421 | ) | -100 | % | ||||||||||
| Tenant recovery revenue |
344 | 327 | 17 | 5 | % | |||||||||||
|
|
|
|
|
|
|
|
|
|||||||||
| Total operating revenues |
43,976 | 41,928 | 2,048 | 5 | % | |||||||||||
|
|
|
|
|
|
|
|
|
|||||||||
| Operating expenses |
||||||||||||||||
| Depreciation and amortization |
14,149 | 13,264 | 885 | 7 | % | |||||||||||
| Property operating expenses |
986 | 971 | 15 | 2 | % | |||||||||||
| Due diligence expense |
700 | 412 | 288 | 70 | % | |||||||||||
| Base management fee |
1,629 | 1,199 | 430 | 36 | % | |||||||||||
| Incentive fee |
3,398 | 3,480 | (82 | ) | -2 | % | ||||||||||
| Administration fee |
1,024 | 1,063 | (39 | ) | -4 | % | ||||||||||
| General and administrative |
1,497 | 3,408 | (1,911 | ) | -56 | % | ||||||||||
|
|
|
|
|
|
|
|
|
|||||||||
| Total operating expenses before credit from Adviser |
23,383 | 23,797 | (414 | ) | -2 | % | ||||||||||
|
|
|
|
|
|
|
|
|
|||||||||
| Credit to base management fee |
— | (225 | ) | 225 | 100 | % | ||||||||||
| Credit to incentive fee |
(2,113 | ) | (158 | ) | (1,955 | ) | 1237 | % | ||||||||
|
|
|
|
|
|
|
|
|
|||||||||
| Total operating expenses |
21,270 | 23,414 | (2,144 | ) | -9 | % | ||||||||||
|
|
|
|
|
|
|
|
|
|||||||||
| Other income (expense) |
||||||||||||||||
| Interest income - employee loans |
36 | 151 | (115 | ) | -76 | % | ||||||||||
| Other income |
48 | 3,326 | (3,278 | ) | -99 | % | ||||||||||
| Interest expense |
(17,076 | ) | (17,063 | ) | (13 | ) | 0 | % | ||||||||
|
|
|
|
|
|
|
|
|
|||||||||
| Total other expense |
(16,992 | ) | (13,586 | ) | (3,406 | ) | 25 | % | ||||||||
|
|
|
|
|
|
|
|
|
|||||||||
| Net income |
5,714 | 4,928 | 786 | 16 | % | |||||||||||
|
|
|
|
|
|
|
|
|
|||||||||
| Distributions attributable to preferred stock |
(4,094 | ) | (4,094 | ) | — | 0 | % | |||||||||
| Distributions attributable to senior common stock |
(62 | ) | (20 | ) | (42 | ) | 210 | % | ||||||||
|
|
|
|
|
|
|
|
|
|||||||||
| Net income available to common stockholders |
$ | 1,558 | $ | 814 | $ | 744 | 91 | % | ||||||||
|
|
|
|
|
|
|
|
|
|||||||||
Operating Revenues
Rental income increased for year ended December 31, 2011, as compared to the year ended December 31, 2010, because of the seven properties acquired during 2011 and the full year of income from our property acquired in December 2010, partially offset by the lost rental income from two of our properties, which are now vacant.
Interest income from mortgage notes receivable decreased for the year ended December 31, 2011, as compared to the year ended December 31, 2010, as our only mortgage loan was fully repaid in July 2010.
Tenant recovery revenue increased slightly for the year ended December 31, 2011, as compared to the year ended December 31, 2010, because of an increase in insurance premiums from 2010, resulting in increased reimbursements from our tenants.
Operating Expenses
Depreciation and amortization expenses increased for the year ended December 31, 2011, as compared to the year ended December 31, 2010, because we acquired seven properties in 2011 and a full year of depreciation was recorded from our property acquired in December 2010.
53
Property operating expenses consist of franchise taxes, management fees, insurance, ground lease payments and overhead expenses paid on behalf of certain of our properties. Property operating expenses increased during the year ended December 31, 2011, as compared to the year ended December 31, 2010, because of overhead expenses for which we are now responsible, which were previously paid directly by our tenants, at our two vacant properties.
Due diligence expense primarily consists of legal fees and fees incurred for third-party reports prepared in connection with potential acquisitions and our due diligence analyses related thereto. Due diligence expense increased for year ended December 31, 2011, as compared to the year ended December 31, 2010, as a result of costs incurred related to the seven properties acquired during 2011, partially offset by an out of period adjustment of $250,000 recorded during 2011 related to the acquisition of the property in Orange City, Iowa in December 2010. See Note 1 to our consolidated financial statements included in Item 8 in this Form 10-K for further detail of the out of period adjustment.
The base management fee increased for the year ended December 31, 2011, as compared to the year ended December 31, 2010, due to an increase in total common stockholders’ equity from the issuance of common stock during 2011, the main component of the calculation. There was no base management fee credit in 2011, as there was in 2010, and we currently do not anticipate having credits to the base management fee in the future. The calculation of the base management fee is described in detail above under “Advisory and Administration Agreements.”
The incentive fee decreased for the year ended December 31, 2011, as compared to the year ended December 31, 2010, due to the increase in common stockholders’ equity from the issuance of common stock during 2011, resulting in a higher hurdle rate to overcome, which is the main component of the calculation. The incentive fee credit increased for the year ended December 31, 2011, as compared to the year ended December 31, 2010, because of the increase in the amount of common stock dividends paid in 2011, which resulted in a larger portion of the incentive fee required to be credited. The calculation of the incentive fee is described in the detail above under “Advisory and Administration Agreement.”
The administration fee decreased for the year ended December 31, 2011, as compared to the year ended December 31, 2010, primarily as a result of a decrease in the amount of the total expenses allocated from our Administrator during the periods, partially offset by an increase in our allocable portion of the total expenses. The calculation of the administration fee is described in detail above under “Advisory and Administration Agreements.”
General and administrative expenses decreased for the year ended December 31, 2011, as compared to the year ended December 31, 2010, primarily due to the write-off of approximately $1.6 million of fees and expenses incurred in relation to the termination of the private offering of unregistered senior common stock in 2010.
Other Income and Expense
Interest income on employee loans decreased during the year ended December 31, 2011, as compared to the year ended December 31, 2010. This decrease was a result of loan payoffs made by employees of our Adviser during 2010 and 2011, coupled with other principal repayments made during the periods.
Other income decreased during the year ended December 31, 2011, as compared to the year ended December 31, 2010, because of $3.3 million in additional income and prepayment fees we received in connection with the early repayment of our mortgage loan in July 2010.
Interest expense increased for the year ended December 31, 2011, as compared to the year ended December 31, 2010. This increase was primarily a result of an increase in the rate on our $45.2 million mortgage loan in October 2011 of 0.18% when the mortgage loan was renewed coupled with interest on the $31.7 million of mortgage debt assumed and issued during 2011. This was partially offset by a decrease of 2.3% in the interest rate charged on our $45.2 million mortgage loan that renewed September 2010, and reduced interest expense on our long-term financings from amortizing principal payments made during 2010 and 2011.
54
Net Income Available to Common Stockholders
Net income available to common stockholders increased for the year ended December 31, 2011, as compared to the year ended December 31, 2010, primarily because of the write-off of $1.6 million of fees related to the termination of the private offering of unregistered senior common stock in 2010 and income earned from the seven properties acquired during 2011, partially offset by the $3.3 million in additional income that was recognized during 2010 related to the early repayment of our mortgage loan.
A comparison of our operating results for the years ended December 31, 2010 and 2009 is below:
| For the year ended December 31, | ||||||||||||||||
| 2010 | 2009 | $ Change | % Change | |||||||||||||
| (Dollars in Thousands) | ||||||||||||||||
| Operating revenues |
||||||||||||||||
| Rental income |
$ | 41,180 | $ | 41,514 | $ | (334 | ) | -1 | % | |||||||
| Interest income from mortgage note receivable |
421 | 760 | (339 | ) | -45 | % | ||||||||||
| Tenant recovery revenue |
327 | 335 | (8 | ) | -2 | % | ||||||||||
|
|
|
|
|
|
|
|
|
|||||||||
| Total operating revenues |
41,928 | 42,609 | (681 | ) | -2 | % | ||||||||||
|
|
|
|
|
|
|
|
|
|||||||||
| Operating expenses |
||||||||||||||||
| Depreciation and amortization |
13,264 | 13,161 | 103 | 1 | % | |||||||||||
| Property operating expenses |
971 | 915 | 56 | 6 | % | |||||||||||
| Due diligence expense |
412 | 41 | 371 | 905 | % | |||||||||||
| Base management fee |
1,199 | 1,401 | (202 | ) | -14 | % | ||||||||||
| Incentive fee |
3,480 | 3,239 | 241 | 7 | % | |||||||||||
| Administration fee |
1,063 | 1,016 | 47 | 5 | % | |||||||||||
| General and administrative |
3,408 | 1,494 | 1,914 | 128 | % | |||||||||||
|
|
|
|
|
|
|
|
|
|||||||||
| Total operating expenses before credit from Adviser |
23,797 | 21,267 | 2,530 | 12 | % | |||||||||||
|
|
|
|
|
|
|
|
|
|||||||||
| Credit to base management fee |
(225 | ) | — | (225 | ) | 100 | % | |||||||||
| Credit to incentive fee |
(158 | ) | (726 | ) | 568 | -78 | % | |||||||||
|
|
|
|
|
|
|
|
|
|||||||||
| Total operating expenses |
23,414 | 20,541 | 2,873 | 14 | % | |||||||||||
|
|
|
|
|
|
|
|
|
|||||||||
| Other income (expense) |
||||||||||||||||
| Interest income - employee loans |
151 | 192 | (41 | ) | -21 | % | ||||||||||
| Other income |
3,326 | 35 | 3,291 | 9403 | % | |||||||||||
| Interest expense |
(17,063 | ) | (17,895 | ) | 832 | -5 | % | |||||||||
|
|
|
|
|
|
|
|
|
|||||||||
| Total other expense |
(13,586 | ) | (17,668 | ) | 4,082 | -23 | % | |||||||||
|
|
|
|
|
|
|
|
|
|||||||||
| Income from continuing operations |
4,928 | 4,400 | 528 | 12 | % | |||||||||||
|
|
|
|
|
|
|
|
|
|||||||||
| Discontinued operations |
||||||||||||||||
| Income from discontinued operations |
— | 43 | (43 | ) | -100 | % | ||||||||||
| Gain on sale of real estate |
— | 160 | (160 | ) | -100 | % | ||||||||||
|
|
|
|
|
|
|
|
|
|||||||||
| Total discontinued operations |
— | 203 | (203 | ) | -100 | % | ||||||||||
|
|
|
|
|
|
|
|
|
|||||||||
| Net income |
4,928 | 4,603 | 325 | 7 | % | |||||||||||
|
|
|
|
|
|
|
|
|
|||||||||
| Distributions attributable to preferred stock |
(4,094 | ) | (4,094 | ) | — | 0 | % | |||||||||
| Distributions attributable to senior common stock |
(20 | ) | — | (20 | ) | 100 | % | |||||||||
|
|
|
|
|
|
|
|
|
|||||||||
| Net income available to common stockholders |
$ | 814 | $ | 509 | $ | 305 | 60 | % | ||||||||
|
|
|
|
|
|
|
|
|
|||||||||
55
Operating Revenues
Rental income remained relatively flat for the year ended December 31, 2010, as compared to the year ended December 31, 2009, as two of our tenants vacated their respective properties during 2010, slightly offset by the acquisition of a property in December 2010.
Interest income from mortgage notes receivable decreased for the year ended December 31, 2010, as compared to the year ended December 31, 2009, as our only mortgage loan was fully repaid in July 2010.
Tenant recovery revenue decreased slightly for the year ended December 31, 2010, as compared to the year ended December 31, 2009, because one of our tenants that vacated their property during 2010 no longer reimburses us for insurance expense.
Operating Expenses
Depreciation and amortization expenses remained relatively flat for the year ended December 31, 2010, as compared to the year ended December 31, 2009, because we only acquired one property in December 2010, which had a minimal impact on the expense.
Property operating expenses consist of franchise taxes, management fees, insurance, ground lease payments and overhead expenses paid on behalf of certain of our properties. Property operating expenses increased during the year ended December 31, 2010, as compared to the year ended December 31, 2009, because of overhead, insurance and franchise tax expenses for which we are now responsible at the two properties where our leases expired and the tenants subsequently vacated during 2010.
Due diligence expenses primarily consist of legal fees and fees incurred for third-party reports prepared in connection with potential acquisitions and our due diligence analyses related thereto. Due diligence expenses increased for the year ended December 31, 2010, as compared to the year ended December 31, 2009, due to fees incurred in connection with the acquisition of the property in Orange City, Iowa in December 2010.
The base management fee decreased for the year ended December 31, 2010, as compared to the year ended December 31, 2009, due to a decrease in total common stockholders’ equity, the main component of the calculation. Total common stockholders’ equity decreased because distributions to common stockholders for the year ended December 31, 2010 exceeded net income during the period by approximately $7.9 million. The calculation of the base management fee is described in detail above under “Advisory and Administration Agreements.”
The incentive fee increased for the year ended December 31, 2010, as compared to the year ended December 31, 2009, due to the increase in pre-incentive fee FFO caused by the $3.3 million of additional income and prepayment fees we received in connection with the early repayment of our mortgage loan, coupled with the decrease in total common stockholders’ equity. The calculation of the incentive fee is described in detail above under “Advisory and Administration Agreements.”
The administration fee increased for the year ended December 31, 2010, as compared to the year ended December 31, 2009, primarily as a result of an increase in the amount of the total expenses allocated from our Administrator during the periods. The calculation of the administration fee is described in detail above under “Advisory and Administration Agreements.”
General and administration expenses, increased during the year ended December 31, 2010, as compared to the year ended December 31, 2009, primarily due to the write-off of approximately $1.6 million of fees and expenses incurred in relation to the private offering of unregistered senior common stock and related dividend reinvestment plan, discussed in “Overview - Recent Developments - Equity Activities” above. In addition, we wrote-off approximately $150,000 of fees incurred in connection with the filing of our base registration statement on Form S-3 with the SEC in 2007. These fees were written off in September 2010 when we filed a new base registration statement on Form S-3 with the SEC.
56
Other Income and Expense
Interest income on employee loans decreased during the year ended December 31, 2010, as compared to the year ended December 31, 2009. This decrease was a result of loan payoffs made by employees of our Adviser during 2009 and 2010, coupled with other principal repayments during 2010.
Other income increased during the year ended December 31, 2010, as compared to the year ended December 31, 2009, because of the $3.3 million in additional income and prepayment fees we received in connection with the early repayment of our mortgage loan in July 2010.
Interest expense decreased for the year ended December 31, 2010, as compared to the year ended December 31, 2009. This decrease was primarily a result of the approximately 2.3% decrease in the interest rate charged on our $48.0 million mortgage loan that was renewed in September 2010, coupled with a decrease in the London Interbank Offered Rate, or LIBOR, from 2009, which reduced our interest expense under our Line of Credit and reduced interest expense on our long-term financings from amortizing principal payments made during 2009 and 2010.
Discontinued Operations
Income from discontinued operations for the year ended December 31, 2009 relates to the property that we sold in July 2009, which was located in Norfolk, Virginia.
Net Income Available to Common Stockholders
Net income available to common stockholders increased for the year ended December 31, 2010, as compared to the year ended December 31, 2009, primarily because of the $3.3 million in additional income and prepayment fees we received in connection with the early repayment of our mortgage loan in July 2010, partially offset by the write-off of $1.6 million in fees related to the termination of our private offering of unregistered senior common stock.
Liquidity and Capital Resources
Overview
Our sources of liquidity include cash flows from operations, cash and cash equivalents, borrowings under our Line of Credit, obtaining mortgages on our unencumbered properties and issuing additional equity securities. Our available liquidity at December 31, 2011 was $14.7 million, including $3.3 million in cash and cash equivalents and an available borrowing capacity of $11.4 million under our Line of Credit.
Future Capital Needs
We actively seek conservative investments that are likely to produce income in order to pay distributions as well as attractive long-term capital gains for our stockholders. We intend to use the proceeds of future equity raised and debt capital borrowed to continue to invest in industrial, commercial and retail real property, make mortgage loans, repurchase shares of our preferred stock on the open market or pay down outstanding borrowings under our Line of Credit. Accordingly, to ensure that we are able to effectively execute our business strategy, we routinely review our liquidity requirements and continually evaluate all potential sources of liquidity. Our short-term liquidity needs include proceeds necessary to fund our distributions to stockholders, pay the debt services costs on our existing long-term mortgages, and fund our current operating costs. Our long-term liquidity needs include proceeds necessary to grow and maintain our portfolio of investments.
We believe that our available liquidity is sufficient to fund our distributions to stockholders, pay the debt service costs on our existing long-term mortgages and fund our current operating costs in the near term. We further believe that our cash flow from operations coupled with the financing capital available to us in the future are sufficient to fund our long-term liquidity needs. Additionally, to satisfy either our short-term or long-term obligations or both, we may require credits to our management fees that are issued from our Adviser, although our Adviser is under no obligation to provide any such credits, either in whole or in part.
57
Equity Capital
Equity capital markets continue to improve. As a result, we were able to raise $3.4 million of common equity pursuant to our Open Market Sales Agreement with Jefferies during 2010. We have not sold any common shares under our Open Market Agreement during 2011; however, we raised, net of offering costs, $14.3 million of common equity in February 2011 and another $22.7 million of common equity in June and July 2011. We also raised $36.8 million of preferred equity, net of offering costs, in February 2012. We used these proceeds to repay a portion of the outstanding balance of the Line of Credit, to acquire additional properties and the remainder for general corporate and working capital needs.
Currently, we have the ability to raise up to $218.7 million of additional equity capital through the sale of securities that are registered under our universal shelf registration statement on Form S-3, or the Universal Shelf, in one or more future public offerings. Of the $218.7 million of available capacity under our Universal Shelf, $21.6 million of common stock is reserved for additional sales under our Open Market Sale Agreement and $52.3 million is reserved for sales of our Senior Common Stock.
Debt Capital
As of December 31, 2011, we had 21 fixed-rate mortgage notes payable in the aggregate principal amount of $286.2 million, collateralized by a total of 59 properties with terms at issuance ranging from 2 years to 25 years. The weighted-average interest rate on the mortgage notes payable as of December 31, 2011 was 5.70%.
We believe that banks are recommencing their general lending practices and the CMBS market is slowly returning, see the discussion in “Overview – Business Environment” above. Specifically, we are beginning to see banks and other non-bank lenders that are willing to issue medium to long-term mortgages, between 5 and 10 years, albeit on less favorable terms than were previously available. Consequently, we are focused on obtaining mortgages through both regional banks, non-bank lenders and CMBS.
We have mortgage debt in the aggregate principal amount of $4.4 million payable during 2012 and $58.5 million payable during 2013. The 2012 principal amount payable does not include $45.2 million of balloon principal payments maturing on one of our long-term mortgages in 2012; however, this mortgage has one remaining annual extension option through 2013, and we intend to exercise this option in 2012. As long as we are in compliance with certain covenants under the mortgage loan, we will be able to exercise the renewal option and will be required to pay a fee of 0.25% of the current outstanding principal balance, or approximately $113,000. The mortgage payments due in 2012 are solely comprised of debt amortization payments. We have no balloon principal payments due under any of our other mortgage loans until 2013 and these are not due until the fourth quarter of 2013; however, we are initiating conversations with lenders in advance of these maturities and anticipate being able to extend the maturity dates or refinance with new lenders. We intend to pay the 2012 debt amortization payments from operating cash flow and borrowings under our Line of Credit.
Operating Activities
Net cash provided by operating activities during the year ended December 31, 2011 was $19.7 million, as compared to net cash provided by operating activities of $18.1 million for the year ended December 31, 2010. This increase was primarily a result of the $750,000 lease modification fee received from the tenant located in our properties in Georgia in connection with the extension of their lease in January 2011, coupled with rental income received from the seven properties acquired in 2011. This was partially offset by expenses incurred during 2010 related to our terminated offering of our unregistered senior common stock, which were not incurred in 2011, two vacancies in our properties during 2011, coupled with the lost interest income from the repayment of our mortgage loan in 2010. The majority of cash from operating
58
activities is generated from the rental payments that we receive from our tenants. We utilize this cash to fund our property-level operating expenses and use the excess cash primarily for debt and interest payments on our mortgage notes payable, interest payments on our Line of Credit, distributions to our stockholders, management fees to our Adviser, and other entity-level expenses.
Investing Activities
Net cash used in investing activities during the year ended December 31, 2011 was $46.0 million, which primarily consisted of the acquisition of seven properties in 2011, coupled with tenant improvements performed at certain of our properties and net payments to our lenders for reserves, as compared to net cash provided by investing activities during the year ended December 31, 2010 of $8.1 million which primarily consisted of the repayment of our $10.0 million mortgage loan, partially offset by the acquisition of one property in 2010, net payments to our lenders for reserves and tenant improvements performed at certain of our properties.
Financing Activities
Net cash provided by financing activities for the year ended December 31, 2011 was $22.6 million, which primarily consisted of proceeds from the sale of common stock and borrowings under mortgage notes payable, partially offset by distributions paid to our stockholders, principal repayments on mortgage notes payable and net repayments on our Line of Credit. Net cash used in financing activities for the year ended December 31, 2010 was $22.2 million, which primarily consisted of distributions paid to our stockholders, principal repayments on mortgage notes payable, payments for deferred financing costs and net repayments to our Line of Credit, partially offset by proceeds from sales of common and senior common stock.
Line of Credit
In December 2010, we procured a $50.0 million Line of Credit maturing on December 28, 2013, with Capital One, N.A. serving as a revolving lender, a letter of credit issuer and as an administrative agent and Branch Banking and Trust Company serving as a revolving lender and a letter of credit issuer. The Line of Credit originally provided for a senior secured revolving credit facility of up to $50.0 million, with a standby letter of credit sublimit of up to $20.0 million. In January 2012, the Line of Credit was expanded to $75.0 million. Currently, ten of our properties are pledged as collateral under our Line of Credit. The interest rate per annum applicable to the Line of Credit is equal to the London Interbank Offered Rate, or LIBOR, plus an applicable margin of up to 3.00% depending upon our leverage. Our leverage ratio used in determining the applicable margin for interest on the Line of Credit is recalculated quarterly. We are subject to an annual maintenance fee of 0.25% per year. Our ability to access this source of financing is subject to our continued ability to meet customary lending requirements such as compliance with financial and operating covenants and our meeting certain lending limits. One such covenant requires us to limit distributions to our stockholders to 95% of our FFO, with acquisition-related costs required to be expensed under ASC 805 added back to FFO for covenant purposes. In addition, the maximum amount that we may draw under this agreement is based on a percentage of the value of properties pledged as collateral to the banks, which must meet agreed upon eligibility standards.
When we are able to procure mortgages for these pledged properties, the banks will release the properties from the Line of Credit and reduce the availability under the Line of Credit by the advanced amount of the released property. Conversely, as we purchase new properties meeting the eligibility standards, we may pledge these new properties to obtain additional advances under this agreement. Our availability under the Line of Credit will also be reduced by letters of credit used in the ordinary course of business. We may use the advances under the Line of Credit for both general corporate purposes and the acquisition of new investments.
At December 31, 2011, there was $18.7 million outstanding under the Line of Credit at an interest rate of 3.0% and $5.6 million outstanding under letters of credit at a weighted average interest rate of 2.8%. At December 31, 2011, the remaining borrowing capacity available under the Line of Credit was $11.4 million. Our ability to increase the availability under our Line of Credit is dependent upon our pledging
59
additional properties as collateral. Traditionally, we have pledged new properties to the Line of Credit as we arrange for long-term mortgages for these pledged properties. Currently, only 13 of our properties do not have long-term mortgages, and 10 of those are pledged as collateral under our Line of Credit. Accordingly, we have only 3 properties which are unencumbered, and which may be pledged as collateral to increase the borrowing capacity available under the Line of Credit. We were in compliance with all covenants under the Line of Credit as of December 31, 2011.
Contractual Obligations
The following table reflects our material contractual obligations as of December 31, 2011:
| Payments Due by Period (Dollars in Thousands) | ||||||||||||||||||||
| Contractual Obligations |
Total | Less than 1 Year | 1-3 Years | 3-5 Years | More than 5 Years | |||||||||||||||
| Debt Obligations (1) |
$ | 304,893 | $ | 49,631 | $ | 53,900 | $ | 115,215 | $ | 86,147 | ||||||||||
| Interest on Debt Obligations (2) |
72,316 | $ | 16,894 | $ | 27,830 | $ | 19,824 | $ | 7,768 | |||||||||||
| Operating Lease Obligations (3) |
8,153 | 411 | 825 | 825 | 6,092 | |||||||||||||||
|
|
|
|
|
|
|
|
|
|
|
|||||||||||
| Total |
$ | 385,362 | $ | 66,936 | $ | 82,555 | $ | 135,864 | $ | 100,007 | ||||||||||
|
|
|
|
|
|
|
|
|
|
|
|||||||||||
| (1) | Debt obligations represent borrowings under our line of credit, which represents $18,700 of the debt obligation due in 2013 and mortgage notes payable that were outstanding as of December 31, 2011. The $45,233 mortgage note issued in September 2008 matures in October 2012, and we expect to exercise our option to extend the maturity date until October 2013. |
| (2) | Interest on debt obligations includes estimated interest on our borrowings under our line of credit. The balance and interest rate on our line of credit is variable; thus, the amount of interest calculated for purposes of this table was based upon rates and balances as of December 31, 2011. |
| (3) | Operating lease obligations represent the ground lease payments due on our Tulsa, Oklahoma, Dartmouth, Massachusetts, and Springfield, Missouri property. |
Off-Balance Sheet Arrangements
We did not have any off-balance sheet arrangements as of December 31, 2011.
60
Item 7A. Quantitative and Qualitative Disclosures About Market Risk.
Market risk includes risks that arise from changes in interest rates, foreign currency exchange rates, commodity prices, equity prices and other market changes that affect market sensitive instruments. The primary risk that we believe we are and will be exposed to is interest rate risk. Five of our fifty-seven leases contain escalations based on market interest rates, and the interest rate on our existing Line of Credit is variable. Although we seek to mitigate this risk by structuring such provisions of our loans and leases to contain a minimum interest rate or escalation rate, as applicable, these features do not eliminate this risk. We have not entered into any derivative contracts to attempt to further manage our exposure to interest rate fluctuations.
To illustrate the potential impact of changes in interest rates on our net income for the year ended December 31, 2011, we have performed the following analysis, which assumes that our balance sheet remains constant and that no further actions beyond a minimum interest rate or escalation rate are taken to alter our existing interest rate sensitivity.
The following table summarizes the impact of a 1%, 2% and 3% increase in the one month LIBOR for the year ended December 31, 2011. As of December 31, 2011, our effective average LIBOR was 0.29%; thus, a 1%, 2% or 3% decrease could not occur.
| (Dollars in Thousands) | ||||||||||||
| Interest Rate Change |
Increase to Rental Income |
Increase to Interest Expense |
Net Decrease to Net Income |
|||||||||
| 1% Increase to LIBOR |
$ | — | $ | 145 | $ | (145 | ) | |||||
| 2% Increase to LIBOR |
— | 290 | (290 | ) | ||||||||
| 3% Increase to LIBOR |
— | 435 | (435 | ) | ||||||||
As of December 31, 2011, the fair value of our fixed rate debt outstanding was $276.2 million. Interest rate fluctuations may affect the fair value of our fixed rate debt instruments. If interest rates on our fixed rate debt instruments, using rates at December 31, 2011, had been one percentage point higher or lower, the fair value of those debt instruments on that date would have decreased or increased by $9.2 million and $9.7 million, respectively.
In the future, we may be exposed to additional effects of interest rate changes, primarily as a result of our Line of Credit or long-term mortgage debt, which we use to maintain liquidity and fund expansion of our real estate investment portfolio and operations. Our interest rate risk management objectives are to limit the impact of interest rate changes on earnings and cash flows and to lower overall borrowing costs. To achieve these objectives, we will borrow primarily at fixed rates or variable rates with the lowest margins available and, in some cases, with the ability to convert variable rates to fixed rates. We may also enter into derivative financial instruments such as interest rate swaps and caps in order to mitigate the interest rate risk on a related financial instrument. We will not enter into derivative or interest rate transactions for speculative purposes.
In addition to changes in interest rates, the value of our real estate is subject to fluctuations based on changes in local and regional economic conditions and changes in the creditworthiness of lessees and borrowers, all of which may affect our ability to refinance debt, if necessary.
61
Item 8. Financial Statements and Supplementary Data.
Index to Consolidated Financial Statements
Report of Management on Internal Controls over Financial Reporting
Report of Independent Registered Public Accounting Firm
Consolidated Balance Sheets as of December 31, 2011 and December 31, 2010
Consolidated Statements of Operations for the years ended December 31, 2011, 2010 and 2009
Consolidated Statements of Stockholders’ Equity for the years ended December 31, 2011, 2010 and 2009
Consolidated Statements of Cash Flows for the years ended December 31, 2011, 2010 and 2009
Notes to Financial Statements
Schedule III – Real Estate and Accumulated Depreciation
62
Report of Management on Internal Controls over Financial Reporting
To the Stockholders and Board of Directors of Gladstone Commercial Corporation:
Our management is responsible for establishing and maintaining adequate internal control over financial reporting, as such term is defined in Rule 13a-15(f) and 15d-15(f) under the Securities Exchange Act of 1934. Our internal control over financial reporting is designed to provide reasonable assurance regarding the reliability of financial reporting and the preparation of financial statements for external purposes in accordance with generally accepted accounting principles and include those policies and procedures that pertain to the maintenance of records that in reasonable detail accurately and fairly reflect our transactions and the dispositions of our assets, provide reasonable assurance that our transactions are recorded as necessary to permit preparation of financial statements in accordance with generally accepted accounting principles, and that our receipts and expenditures are being made only in accordance with appropriate authorizations; and provide reasonable assurance regarding prevention or timely detection of unauthorized acquisition, use or disposition of our assets that could have a material effect on our financial statements.
Because of its inherent limitations, internal control over financial reporting may not prevent or detect misstatements. Therefore, even those systems determined to be effective can provide only reasonable assurance with respect to financial statement preparation and presentation.
Under the supervision and with the participation of our management, we assessed the effectiveness of our internal control over financial reporting based on the framework in Internal Control - Integrated Framework issued by the Committee of Sponsoring Organizations (COSO). Based on our assessment, management concluded that our internal control over financial reporting was effective as of December 31, 2011.
The effectiveness of our internal control over financial reporting as of December 31, 2011 has been audited by PricewaterhouseCoopers LLP, an independent registered public accounting firm, as stated in their report which is included herein.
February 28, 2012
63
Report of Independent Registered Public Accounting Firm
To the Stockholders and Board of Directors of Gladstone Commercial Corporation:
In our opinion, the consolidated financial statements listed in the accompanying index present fairly, in all material respects, the financial position of Gladstone Commercial Corporation and its subsidiaries at December 31, 2011 and December 31, 2010, and the results of their operations and their cash flows for each of the three years in the period ended December 31, 2011 in conformity with accounting principles generally accepted in the United States of America. In addition, in our opinion, the financial statement schedules listed in the accompanying index present fairly, in all material respects, the information set forth therein when read in conjunction with the related consolidated financial statements. Also in our opinion, the Company maintained, in all material respects, effective internal control over financial reporting as of December 31, 2011 based on criteria established in Internal Control - Integrated Framework issued by the Committee of Sponsoring Organizations of the Treadway Commission (COSO). The Company’s management is responsible for these financial statements and the financial statement schedule, for maintaining effective internal control over financial reporting and for its assessment of the effectiveness of internal control over financial reporting, included in the accompanying Report of Management on Internal Control Over Financial Reporting. Our responsibility is to express opinions on these financial statements, on the financial statement schedules, and on the Company’s internal control over financial reporting based on our integrated audits. We conducted our audits in accordance with the standards of the Public Company Accounting Oversight Board (United States). Those standards require that we plan and perform the audits to obtain reasonable assurance about whether the financial statements are free of material misstatement and whether effective internal control over financial reporting was maintained in all material respects. Our audits of the financial statements included examining, on a test basis, evidence supporting the amounts and disclosures in the financial statements, assessing the accounting principles used and significant estimates made by management, and evaluating the overall financial statement presentation. Our audit of internal control over financial reporting included obtaining an understanding of internal control over financial reporting, assessing the risk that a material weakness exists, and testing and evaluating the design and operating effectiveness of internal control based on the assessed risk. Our audits also included performing such other procedures as we considered necessary in the circumstances. We believe that our audits provide a reasonable basis for our opinions.
A company’s internal control over financial reporting is a process designed to provide reasonable assurance regarding the reliability of financial reporting and the preparation of financial statements for external purposes in accordance with generally accepted accounting principles. A company’s internal control over financial reporting includes those policies and procedures that (i) pertain to the maintenance of records that, in reasonable detail, accurately and fairly reflect the transactions and dispositions of the assets of the company; (ii) provide reasonable assurance that transactions are recorded as necessary to permit preparation of financial statements in accordance with generally accepted accounting principles, and that receipts and expenditures of the company are being made only in accordance with authorizations of management and directors of the company; and (iii) provide reasonable assurance regarding prevention or timely detection of unauthorized acquisition, use, or disposition of the company’s assets that could have a material effect on the financial statements.
64
Because of its inherent limitations, internal control over financial reporting may not prevent or detect misstatements. Also, projections of any evaluation of effectiveness to future periods are subject to the risk that controls may become inadequate because of changes in conditions, or that the degree of compliance with the policies or procedures may deteriorate.
/s/ PricewaterhouseCoopers LLP
McLean, VA
February 28, 2012
65
Gladstone Commercial Corporation
Consolidated Balance Sheets
(Dollars in Thousands, Except Share and Per Share Amounts)
| December 31, 2011 | December 31, 2010 | |||||||
| ASSETS |
||||||||
| Real estate, at cost |
$ | 442,521 | $ | 401,017 | ||||
| Less: accumulated depreciation |
53,784 | 43,659 | ||||||
|
|
|
|
|
|||||
| Total real estate, net |
388,737 | 357,358 | ||||||
| Lease intangibles, net |
37,670 | 26,747 | ||||||
| Cash and cash equivalents |
3,329 | 7,062 | ||||||
| Restricted cash |
2,473 | 2,288 | ||||||
| Funds held in escrow |
4,086 | 2,621 | ||||||
| Deferred rent receivable, net |
12,403 | 10,373 | ||||||
| Deferred financing costs, net |
3,473 | 3,326 | ||||||
| Other assets |
976 | 834 | ||||||
|
|
|
|
|
|||||
| TOTAL ASSETS |
$ | 453,147 | $ | 410,609 | ||||
|
|
|
|
|
|||||
| LIABILITIES AND STOCKHOLDERS’ EQUITY |
||||||||
| LIABILITIES |
||||||||
| Mortgage notes payable |
$ | 285,350 | $ | 259,595 | ||||
| Borrowings under line of credit |
18,700 | 27,000 | ||||||
| Deferred rent liability, net |
3,851 | 2,276 | ||||||
| Asset retirement obligation liability |
3,289 | 3,063 | ||||||
| Accounts payable and accrued expenses |
1,956 | 2,683 | ||||||
| Due to Adviser (1) |
1,188 | 965 | ||||||
| Other liabilities |
3,499 | 3,652 | ||||||
|
|
|
|
|
|||||
| Total Liabilities |
317,833 | 299,234 | ||||||
|
|
|
|
|
|||||
| STOCKHOLDERS’ EQUITY |
||||||||
| Series A and B redeemable preferred stock, $0.001 par value; $25 liquidation preference; 2,300,000 shares authorized and 2,150,000 shares issued and outstanding at December 31, 2011 and December 31, 2010, respectively |
2 | 2 | ||||||
| Senior common stock, $0.001 par value; 7,500,000 shares authorized and 60,290 and 59,057 shares issued and outstanding at December 31, 2011 and December 31, 2010, respectively |
— | — | ||||||
| Common stock, $0.001 par value, 40,200,000 shares authorized and 10,945,379 and 8,724,613 shares issued and outstanding at December 31, 2011 and December 31, 2010, respectively |
11 | 9 | ||||||
| Additional paid in capital |
211,553 | 174,261 | ||||||
| Notes receivable - employees |
(422 | ) | (963 | ) | ||||
| Distributions in excess of accumulated earnings |
(75,830 | ) | (61,934 | ) | ||||
|
|
|
|
|
|||||
| Total Stockholders’ Equity |
135,314 | 111,375 | ||||||
|
|
|
|
|
|||||
| TOTAL LIABILITIES AND STOCKHOLDERS’ EQUITY |
$ | 453,147 | $ | 410,609 | ||||
|
|
|
|
|
|||||
| (1) | Refer to Note 2 Related-Party Transactions |
The accompanying notes are an integral part of these consolidated financial statements.
66
Gladstone Commercial Corporation
Consolidated Statements of Operations
(Dollars in Thousands, Except Per Share Data)
| For the year ended December 31, | ||||||||||||
| 2011 | 2010 | 2009 | ||||||||||
| Operating revenues |
||||||||||||
| Rental income |
$ | 43,632 | $ | 41,180 | $ | 41,514 | ||||||
| Interest income from mortgage note receivable |
— | 421 | 760 | |||||||||
| Tenant recovery revenue |
344 | 327 | 335 | |||||||||
|
|
|
|
|
|
|
|||||||
| Total operating revenues |
43,976 | 41,928 | 42,609 | |||||||||
|
|
|
|
|
|
|
|||||||
| Operating expenses |
||||||||||||
| Depreciation and amortization |
14,149 | 13,264 | 13,161 | |||||||||
| Property operating expenses |
986 | 971 | 915 | |||||||||
| Due diligence expense |
700 | 412 | 41 | |||||||||
| Base management fee (1) |
1,629 | 1,199 | 1,401 | |||||||||
| Incentive fee (1) |
3,398 | 3,480 | 3,239 | |||||||||
| Administration fee (1) |
1,024 | 1,063 | 1,016 | |||||||||
| General and administrative |
1,497 | 3,408 | 1,494 | |||||||||
|
|
|
|
|
|
|
|||||||
| Total operating expenses before credits from Adviser |
23,383 | 23,797 | 21,267 | |||||||||
|
|
|
|
|
|
|
|||||||
| Credit to base management fee |
— | (225 | ) | — | ||||||||
| Credit to incentive fee |
(2,113 | ) | (158 | ) | (726 | ) | ||||||
|
|
|
|
|
|
|
|||||||
| Total operating expenses |
21,270 | 23,414 | 20,541 | |||||||||
|
|
|
|
|
|
|
|||||||
| Other income (expense) |
||||||||||||
| Interest income - employee loans |
36 | 151 | 192 | |||||||||
| Other income |
48 | 3,326 | 35 | |||||||||
| Interest expense |
(17,076 | ) | (17,063 | ) | (17,895 | ) | ||||||
|
|
|
|
|
|
|
|||||||
| Total other expense |
(16,992 | ) | (13,586 | ) | (17,668 | ) | ||||||
|
|
|
|
|
|
|
|||||||
| Income from continuing operations |
5,714 | 4,928 | 4,400 | |||||||||
|
|
|
|
|
|
|
|||||||
| Discontinued operations |
||||||||||||
| Income from discontinued operations |
— | — | 43 | |||||||||
| Gain on sale of real estate |
— | — | 160 | |||||||||
|
|
|
|
|
|
|
|||||||
| Total discontinued operations |
— | — | 203 | |||||||||
|
|
|
|
|
|
|
|||||||
| Net income |
5,714 | 4,928 | 4,603 | |||||||||
|
|
|
|
|
|
|
|||||||
| Distributions attributable to preferred stock |
(4,094 | ) | (4,094 | ) | (4,094 | ) | ||||||
| Distributions attributable to senior common stock |
(62 | ) | (20 | ) | — | |||||||
|
|
|
|
|
|
|
|||||||
| Net income available to common stockholders |
$ | 1,558 | $ | 814 | $ | 509 | ||||||
|
|
|
|
|
|
|
|||||||
| Earnings per weighted average share of common stock - basic & diluted |
||||||||||||
| Income from continuing operations (net of dividends attributable to preferred stock) |
$ | 0.15 | $ | 0.09 | $ | 0.04 | ||||||
| Discontinued operations |
— | — | 0.02 | |||||||||
|
|
|
|
|
|
|
|||||||
| Net income available to common stockholders |
$ | 0.15 | $ | 0.09 | $ | 0.06 | ||||||
|
|
|
|
|
|
|
|||||||
| Weighted average shares of common stock outstanding |
||||||||||||
| Basic |
10,237 | 8,576 | 8,563 | |||||||||
|
|
|
|
|
|
|
|||||||
| Diluted |
10,289 | 8,601 | 8,563 | |||||||||
|
|
|
|
|
|
|
|||||||
| Earnings per weighted average share of senior common stock |
$ | 1.05 | $ | 0.81 | $ | — | ||||||
|
|
|
|
|
|
|
|||||||
| Weighted average shares of senior common stock outstanding - basic |
59 | 25 | 0 | |||||||||
|
|
|
|
|
|
|
|||||||
| (1) | Refer to Note 2 Related-Party Transactions |
The accompanying notes are an integral part of these consolidated financial statements.
67
Gladstone Commercial Corporation
Consolidated Statements of Stockholders’ Equity
(Dollars in Thousands)
| Preferred Stock |
Senior Common Stock |
Common Stock |
Capital in Excess of Par Value |
Notes Receivable from Employees |
Distributions in Excess of Accumulated Earnings |
Total Stockholders’ Equity |
||||||||||||||||||||||
| Balance at December 31, 2008 |
$ | 2 | $ | — | $ | 9 | $ | 170,623 | $ | (2,596 | ) | $ | (37,542 | ) | $ | 130,496 | ||||||||||||
|
|
|
|
|
|
|
|
|
|
|
|
|
|
|
|||||||||||||||
| Repayment of principal on employee notes receivable |
— | — | — | — | 46 | — | 46 | |||||||||||||||||||||
| Reclassification of loan balance to other assets |
— | — | — | — | 245 | — | 245 | |||||||||||||||||||||
| Distributions declared to common and preferred stockholders |
— | — | — | — | — | (16,939 | ) | (16,939 | ) | |||||||||||||||||||
| Net income |
— | — | — | — | — | 4,603 | 4,603 | |||||||||||||||||||||
|
|
|
|
|
|
|
|
|
|
|
|
|
|
|
|||||||||||||||
| Balance at December 31, 2009 |
$ | 2 | $ | — | $ | 9 | $ | 170,623 | $ | (2,305 | ) | $ | (49,878 | ) | $ | 118,451 | ||||||||||||
|
|
|
|
|
|
|
|
|
|
|
|
|
|
|
|||||||||||||||
| Issuance of senior common stock and common stock, net |
— | — | — | 3,882 | — | — | 3,882 | |||||||||||||||||||||
| Repayment of principal on employee notes receivable |
— | — | — | — | 1,342 | — | 1,342 | |||||||||||||||||||||
| Distributions declared to common, senior common and preferred stockholders |
— | — | — | — | — | (16,984 | ) | (16,984 | ) | |||||||||||||||||||
| Forfeiture of common stock in satisfaction of employee note receivable |
— | — | — | (244 | ) | — | — | (244 | ) | |||||||||||||||||||
| Net income |
— | — | — | — | — | 4,928 | 4,928 | |||||||||||||||||||||
|
|
|
|
|
|
|
|
|
|
|
|
|
|
|
|||||||||||||||
| Balance at December 31, 2010 |
$ | 2 | $ | — | $ | 9 | $ | 174,261 | $ | (963 | ) | $ | (61,934 | ) | $ | 111,375 | ||||||||||||
|
|
|
|
|
|
|
|
|
|
|
|
|
|
|
|||||||||||||||
| Issuance of common stock, net |
— | — | 2 | 37,292 | — | — | 37,294 | |||||||||||||||||||||
| Repayment of principal on employee notes receivable |
— | — | — | — | 541 | — | 541 | |||||||||||||||||||||
| Distributions declared to common, senior common and preferred stockholders |
— | — | — | — | — | (19,610 | ) | (19,610 | ) | |||||||||||||||||||
| Net income |
— | — | — | — | — | 5,714 | 5,714 | |||||||||||||||||||||
|
|
|
|
|
|
|
|
|
|
|
|
|
|
|
|||||||||||||||
| Balance at December 31, 2011 |
$ | 2 | $ | — | $ | 11 | $ | 211,553 | $ | (422 | ) | $ | (75,830 | ) | $ | 135,314 | ||||||||||||
|
|
|
|
|
|
|
|
|
|
|
|
|
|
|
|||||||||||||||
The accompanying notes are an integral part of these consolidated financial statements.
68
Gladstone Commercial Corporation
Consolidated Statements of Cash Flows
(Dollars in Thousands)
| For the year ended December 31, | ||||||||||||
| 2011 | 2010 | 2009 | ||||||||||
| Cash flows from operating activities: |
||||||||||||
| Net income |
$ | 5,714 | $ | 4,928 | $ | 4,603 | ||||||
| Adjustments to reconcile net income to net cash provided by operating activities: |
||||||||||||
| Depreciation and amortization |
14,149 | 13,264 | 13,172 | |||||||||
| Amortization of deferred financing costs |
918 | 1,003 | 1,491 | |||||||||
| Amortization of deferred rent asset and liability, net |
(616 | ) | (684 | ) | (532 | ) | ||||||
| Amortization of discount and premium on assumed debt |
94 | 11 | — | |||||||||
| Asset retirement obligation expense |
157 | 143 | 144 | |||||||||
| Gain on sale of real estate |
— | — | (160 | ) | ||||||||
| (Increase) decrease in other assets |
(142 | ) | 389 | (960 | ) | |||||||
| Increase in deferred rent liability |
1,626 | — | — | |||||||||
| Increase in deferred rent receivable |
(1,394 | ) | (1,652 | ) | (1,177 | ) | ||||||
| (Decrease) increase in accounts payable, accrued expenses, and amount due Adviser |
(504 | ) | 348 | 735 | ||||||||
| (Decrease) increase in other liabilities |
(340 | ) | 363 | (303 | ) | |||||||
|
|
|
|
|
|
|
|||||||
| Net cash provided by operating activities |
19,662 | 18,113 | 17,013 | |||||||||
|
|
|
|
|
|
|
|||||||
| Cash flows from investing activities: |
||||||||||||
| Real estate investments |
(44,525 | ) | (2,419 | ) | (1,140 | ) | ||||||
| Leasing commissions paid |
(6 | ) | (7 | ) | (441 | ) | ||||||
| Proceeds from sale of real estate |
— | — | 1,089 | |||||||||
| Principal repayments on mortgage notes receivable |
— | 10,000 | — | |||||||||
| Receipts from lenders for funds held in escrow |
1,911 | 1,618 | 1,465 | |||||||||
| Payments to lenders for funds held in escrow |
(3,376 | ) | (1,751 | ) | (1,802 | ) | ||||||
| Receipts from tenants for reserves |
2,205 | 2,155 | 4,454 | |||||||||
| Payments to tenants from reserves |
(2,031 | ) | (2,130 | ) | (4,526 | ) | ||||||
| (Increase) decrease in restricted cash |
(185 | ) | 345 | 44 | ||||||||
| Deposits on future acquisitions |
— | — | (250 | ) | ||||||||
| Deposits refunded |
— | 250 | 200 | |||||||||
|
|
|
|
|
|
|
|||||||
| Net cash (used in) provided by investing activities |
(46,007 | ) | 8,061 | (907 | ) | |||||||
|
|
|
|
|
|
|
|||||||
| Cash flows from financing activities: |
||||||||||||
| Proceeds from issuance of equity |
39,707 | 4,127 | — | |||||||||
| Offering costs |
(2,412 | ) | (249 | ) | — | |||||||
| Borrowings under mortgage notes payable |
20,052 | — | — | |||||||||
| Principal repayments on mortgage notes payable |
(6,311 | ) | (2,687 | ) | (2,350 | ) | ||||||
| Principal repayments on employee notes receivable |
542 | 1,341 | 291 | |||||||||
| Borrowings from line of credit |
58,474 | 32,795 | 57,600 | |||||||||
| Repayments on line of credit |
(66,774 | ) | (38,995 | ) | (35,900 | ) | ||||||
| Repayment of short-term loan |
— | — | (20,000 | ) | ||||||||
| Increase (decrease) in security deposits |
9 | (370 | ) | 28 | ||||||||
| Payments for deferred financing costs |
(1,065 | ) | (1,192 | ) | (244 | ) | ||||||
| Distributions paid for common, senior common and preferred stock |
(19,610 | ) | (16,979 | ) | (16,938 | ) | ||||||
|
|
|
|
|
|
|
|||||||
| Net cash provided by (used in) financing activities |
22,612 | (22,209 | ) | (17,513 | ) | |||||||
|
|
|
|
|
|
|
|||||||
| Net (decrease) increase in cash and cash equivalents |
(3,733 | ) | 3,965 | (1,407 | ) | |||||||
| Cash and cash equivalents, beginning of year |
7,062 | 3,097 | 4,504 | |||||||||
|
|
|
|
|
|
|
|||||||
| Cash and cash equivalents, end of year |
$ | 3,329 | $ | 7,062 | $ | 3,097 | ||||||
|
|
|
|
|
|
|
|||||||
| Cash paid during year for interest |
$ | 17,076 | $ | 17,970 | $ | 16,559 | ||||||
|
|
|
|
|
|
|
|||||||
| NON-CASH OPERATING, INVESTING AND FINANCING INFORMATION |
||||||||||||
| Increase in asset retirement obligation |
$ | 69 | $ | 614 | $ | — | ||||||
|
|
|
|
|
|
|
|||||||
| Fixed rate debt assumed in connection with acquisitions |
$ | 11,921 | $ | 10,795 | $ | — | ||||||
|
|
|
|
|
|
|
|||||||
| Forfeiture of common stock in satisfaction of employee note receivable |
$ | — | $ | 244 | $ | — | ||||||
|
|
|
|
|
|
|
|||||||
| Senior common dividend issued in the dividend reinvestment program |
$ | — | $ | 4 | $ | — | ||||||
|
|
|
|
|
|
|
|||||||
| Reclassification of principal on employee note |
$ | — | $ | — | $ | 245 | ||||||
|
|
|
|
|
|
|
|||||||
| Leasing commissions included in accounts payable |
$ | — | $ | 458 | $ | — | ||||||
|
|
|
|
|
|
|
|||||||
The accompanying notes are an integral part of these consolidated financial statements.
69
Gladstone Commercial Corporation
Notes to Consolidated Financial Statements
(Dollars in Thousands, Except Share and Per Share Data or Unless Otherwise Indicated)
1. Organization and Significant Accounting Policies
Gladstone Commercial Corporation (the “Company”) is a real estate investment trust (“REIT”), that was incorporated under the General Corporation Laws of the State of Maryland on February 14, 2003 primarily for the purpose of investing in and owning net leased industrial, commercial and retail real property and selectively making long-term industrial and commercial mortgage loans. Subject to certain restrictions and limitations, the business of the Company is managed by Gladstone Management Corporation, a Delaware corporation (the “Adviser”).
Subsidiaries
The Company conducts substantially all of its operations through a subsidiary, Gladstone Commercial Limited Partnership, a Delaware limited partnership (the “Operating Partnership”). As the Company currently owns all of the general and limited partnership interests of the Operating Partnership through GCLP Business Trust I and II, as discussed in more detail below, the financial position and results of operations of the Operating Partnership are consolidated with those of the Company.
Gladstone Commercial Lending, LLC, a Delaware limited liability company (“Gladstone Commercial Lending”) and a subsidiary of the Company, was created to conduct all operations related to real estate mortgage loans of the Company. As the Operating Partnership currently owns all of the membership interests of Gladstone Commercial Lending, the financial position and results of operations of Gladstone Commercial Lending are consolidated with those of the Company.
Gladstone Commercial Advisers, Inc., a Delaware corporation (“Commercial Advisers”) and a subsidiary of the Company, is a taxable REIT subsidiary (“TRS”), which was created to collect all non-qualifying income related to the Company’s real estate portfolio. There has been no such income earned to date. Since the Company owns 100% of the voting securities of Commercial Advisers, the financial position and results of operations of Commercial Advisers are consolidated with those of the Company.
GCLP Business Trust I and GCLP Business Trust II, each a subsidiary and business trust of the Company, were formed under the laws of the Commonwealth of Massachusetts on December 28, 2005. The Company transferred its 99% limited partnership interest in the Operating Partnership to GCLP Business Trust I in exchange for 100 trust shares. Gladstone Commercial Partners, LLC transferred its 1% general partnership interest in the Operating Partnership to GCLP Business Trust II in exchange for 100 trust shares.
Out of Period Adjustment
During 2011, the Company recorded adjustments to due diligence expense, depreciation and amortization expense and to certain balance sheet accounts in connection with the property the Company acquired in December 2010. As a result of these errors, the Company understated net income by $250 for the year ended December 31, 2010, or $0.03 per share. The Company concluded that these adjustments were not material to the 2010 results of operations nor to the 2011 results. As such, these adjustments were recorded during 2011.
70
Use of Estimates
The preparation of financial statements in conformity with Generally Accepted Accounting Principles in the United States, or GAAP, requires management to make estimates and assumptions that affect the reported amounts of assets and liabilities and disclosure of contingent assets and liabilities at the date of the financial statements and the reported amounts of revenues and expenses during the reporting periods. Actual results could materially differ from those estimates.
Reclassifications
Certain line items on the consolidated balance sheets, consolidated statements of operations and consolidated statements of cash flows from prior years’ financial statements have been reclassified to conform to the current year presentation. These reclassifications had no effect on previously reported total assets, total liabilities, stockholders’ equity or net income.
Real Estate and Lease Intangibles
The Company records investments in real estate at cost and capitalizes improvements and replacements when they extend the useful life or improve the efficiency of the asset. The Company expenses costs of repairs and maintenance as such costs are incurred. The Company computes depreciation using the straight-line method over the estimated useful life or 39 years for buildings and improvements, 5 to 7 years for equipment and fixtures, and the shorter of the useful life or the remaining lease term for tenant improvements and leasehold interests.
The Company accounts for its acquisitions of real estate in accordance with Accounting Standards Codification (“ASC”) 805, “Business Combinations,” which requires that the purchase price of real estate be recorded at fair value and allocated to the acquired tangible assets and liabilities, consisting of land, building, tenant improvements, long-term debt and identified intangible assets and liabilities, consisting of the value of above-market and below-market leases, the value of in-place leases, the value of unamortized lease origination costs, the value of tenant relationships and the value of capital lease obligations, based in each case on their fair values. ASC 805 also requires that all expenses related to the acquisition be expensed as incurred, rather than capitalized into the cost of the acquisition as had been the previous accounting.
Management’s estimates of fair value are made using methods similar to those used by independent appraisers (e.g. discounted cash flow analysis). Factors considered by management in its analysis include an estimate of carrying costs during hypothetical expected lease-up periods considering current market conditions and costs to execute similar leases. The Company also considers information obtained about each property as a result of its pre-acquisition due diligence, marketing and leasing activities in estimating the fair value of the tangible and intangible assets and liabilities acquired. In estimating carrying costs, management also includes real estate taxes, insurance and other operating expenses and estimates of lost rentals at market rates during the hypothetical expected lease-up periods, which primarily range from nine to eighteen months, depending on specific local market conditions. Management also estimates costs to execute similar leases, including leasing commissions, legal and other related expenses to the extent that such costs are not already incurred in connection with a new lease origination as part of the transaction.
The Company allocates purchase price to the fair value of the tangible assets of an acquired property by valuing the property as if it were vacant. The “as-if-vacant” value is allocated to land, building and tenant improvements based on management’s determination of the relative fair values of these assets. Real estate depreciation expense on these tangible assets, was $10,125, $9,548 and $9,444 for the years ended December 31, 2011, 2010 and 2009, respectively.
Above-market and below-market in-place lease values for owned properties are recorded based on the present value (using an interest rate which reflects the risks associated with the leases acquired) of the difference between (i) the contractual amounts to be paid pursuant to the in-place leases and (ii) management’s estimate of fair market lease rates for the corresponding in-place leases, measured over a
71
period equal to the remaining non-cancelable term of the lease. When determining the non-cancelable term of the lease, the Company evaluates if fixed-rate renewal options, if any, should be included. The capitalized above-market lease values, included in the accompanying balance sheet as part of deferred rent receivable, are amortized as a reduction of rental income over the remaining non-cancelable terms of the respective leases. Total amortization related to above-market lease values was $336 for the year ended December 31, 2011 and $253 for each of the years ended December 31, 2010 and 2009, respectively. The capitalized below-market lease values, included in the accompanying consolidated balance sheets as part of deferred rent liability, are amortized as an increase to rental income over the remaining non-cancelable terms of the respective leases. Total amortization related to below-market lease values was $952, $937 and $785 for the years ended December 31, 2011, 2010 and 2009, respectively.
The total amount of the remaining intangible assets acquired, which consists of in-place lease values, unamortized lease origination costs, and customer relationship intangible values, are allocated based on management’s evaluation of the specific characteristics of each tenant’s lease and the Company’s overall relationship with that respective tenant. Characteristics to be considered by management in determining these values include the nature and extent of our existing business relationships with the tenant, growth prospects for developing new business with the tenant, the tenant’s credit quality and the Company’s expectations of lease renewals (including those existing under the terms of the lease agreement), among other factors.
The value of in-place leases and unamortized lease origination costs are amortized to expense over the remaining term of the respective leases, which generally range from 10 to 15 years. The value of customer relationship intangibles, which is the benefit to the Company resulting from the likelihood of an existing tenant renewing its lease, are amortized to expense over the remaining term and any anticipated renewal periods in the respective leases, but in no event does the amortization period for intangible assets exceed the remaining depreciable life of the building. Should a tenant terminate its lease, the unamortized portion of the above-market and below-market lease values, in-place lease values, unamortized lease origination costs and customer relationship intangibles will be immediately charged to the related income or expense. Total amortization expense related to these intangible assets was $4,024, $3,716 and $3,728 for the years ended December 31, 2011, 2010 and 2009, respectively.
Impairment
The Company accounts for the impairment of real estate, including intangible assets, in accordance with ASC 360-10-35, “Property, Plant, and Equipment,” which requires the Company to periodically review the carrying value of each property to determine if circumstances indicate impairment of the carrying value of the investment exists or that depreciation periods should be modified. If circumstances support the possibility of impairment, the Company prepares a projection of the undiscounted future cash flows, without interest charges, of the specific property and determines if the investment in such property is recoverable. If impairment is indicated, the Company will write down the carrying value of the property to its estimated fair value.
In light of current economic conditions, the Company evaluates its entire portfolio each quarter for any impairment indicators and performed an impairment analysis on those select properties that had an indication of impairment. In performing the analysis, the Company considered such factors as the tenants’ payment history and financial condition, the likelihood of lease renewal, business conditions in the industry in which the tenants operate and whether the fair value of the real estate has decreased. The Company concluded that none of its properties were impaired as of December 31, 2011, and will continue to monitor its portfolio for any indicators that may change this conclusion. There have been no impairments recognized on real estate assets since inception.
72
Cash and Cash Equivalents
The Company considers cash equivalents to be all short-term, highly-liquid investments that are both readily convertible to cash and have a maturity of three months or less at the time of purchase, except that any such investments purchased with funds held in escrow or similar accounts are classified as restricted cash. Items classified as cash equivalents include money-market deposit accounts. The Company’s cash and cash equivalents at December 31, 2011 were primarily held in the custody of two financial institutions, and the Company’s balance at times may exceed federally insurable limits.
Restricted Cash
Restricted cash consists of security deposits and receipts from tenants for reserves. These funds will be released to the tenants upon completion of agreed upon tasks, as specified in the lease agreements, mainly consisting of maintenance and repairs on the buildings and upon receipt by the Company of evidence of insurance and tax payments. For purposes of the statements of cash flows, changes in restricted cash caused by changes in reserves held for tenants are shown as investing activities. Changes in restricted cash caused by changes in security deposits are reflected in cash from financing activities.
Funds Held in Escrow
Funds held in escrow consist of funds held by certain of the Company’s lenders for properties held as collateral by these lenders. These funds will be released to the Company upon completion of agreed upon tasks, as specified in the mortgage agreements, mainly consisting of maintenance and repairs on the buildings, and when evidence of insurance and tax payments has been submitted to the lenders.
Deferred Financing Costs
Deferred financing costs consist of costs incurred to obtain financing, including legal fees, origination fees and administrative fees. The costs are deferred and amortized using the straight-line method, which approximates the effective interest method, over the term of the secured financing. The Company made payments of $1,065, $1,192 and $244 for deferred financing costs during the years ended December 31, 2011, 2010 and 2009, respectively. Total amortization expense related to deferred financing costs is included in interest expense and was $918, $1,002 and $1,491 for the years ended December 31, 2011, 2010 and 2009, respectively.
Obligation Under Capital Lease
In conjunction with the Company’s acquisition of a building in Fridley, Minnesota in February 2008, the Company acquired a ground lease on the parking lot of the building, which had a purchase obligation to acquire the land under the ground lease at the end of the term in April 2014 for $300. In accordance with ASC 840-10-25, “Leases,” the Company accounted for the ground lease as a capital lease and recorded the corresponding present value of the obligation under the capital lease. The Company recorded total interest expense related to the accretion of the capital lease obligation of $11 for the year ended December 31, 2011 and $12 for the years ended December 31, 2010 and 2009, respectively. The Company purchased the parking lot on December 20, 2011 for $302; including $2 of legal fees.
Revenue Recognition
Rental revenue includes rents that each tenant pays in accordance with the terms of its respective lease reported evenly over the non-cancelable term of the lease. Most of the Company’s leases contain rental increases at specified intervals. The Company recognizes such revenues on a straight-line basis. Deferred rent receivable in the accompanying consolidated balance sheet includes the cumulative difference between rental revenue, as recorded on a straight-line basis, and rents received from the tenants in accordance with the lease terms, along with the capitalized above-market and below-market in-place lease values of certain acquired properties. Accordingly, the Company determines, in its judgment, to what extent the deferred rent receivable applicable to each specific tenant is collectable. The Company reviews deferred rent
73
receivable, as it relates to straight line rents, on a quarterly basis and takes into consideration the tenant’s payment history, the financial condition of the tenant, business conditions in the industry in which the tenant operates and economic conditions in the geographic area in which the property is located. In the event that the collectability of deferred rent with respect to any given tenant is in doubt, the Company records an allowance for uncollectable accounts or records a direct write-off of the specific rent receivable. No such reserves or direct write-offs have been recorded as of December 31, 2011 or 2010.
Tenant recovery revenue includes payments from tenants as reimbursements for franchise taxes, management fees, insurance, and ground lease payments. The Company recognizes tenant recovery revenue in the same periods that it incurs the related expenses.
Income Taxes
The Company has operated and intends to continue to operate in a manner that will allow it to qualify as a REIT under the Internal Revenue Code of 1986, as amended, and, accordingly, will not be subject to federal income taxes on amounts distributed to stockholders (except income from foreclosure property), provided that it distributes at least 90% of its REIT taxable income to its stockholders and meets certain other conditions. To the extent that the Company satisfies the distribution requirement but distributes less than 100% of its taxable income, the Company will be subject to federal corporate income tax on its undistributed income.
Commercial Advisers is a wholly-owned TRS that is subject to federal and state income taxes. Though Commercial Advisers has had no activity to date, the Company would account for any future income taxes in accordance with the provisions of ASC 740, “Income Taxes.” Under ASC 740-10-25, the Company accounts for income taxes using the asset and liability method under which deferred tax assets and liabilities are recognized for the future tax consequences attributable to differences between the financial statement carrying amounts of existing assets and liabilities and their respective tax bases.
The Company may recognize a tax benefit from an uncertain tax position when it is more-likely-than-not (defined as a likelihood of more than 50%) that the position will be sustained upon examination, including resolutions of any related appeals or litigation processes, based on the technical merits. If a tax position does not meet the more-likely-than-not recognition threshold, despite the Company’s belief that it’s filing position is supportable, the benefit of that tax position is not recognized in the statements of operations. The Company recognizes interest and penalties, as applicable, related to unrecognized tax benefits as a component of income tax expense. The Company recognizes unrecognized tax benefits in the period that the uncertainty is eliminated by either affirmative agreement of the uncertain tax position by the applicable taxing authority, or by expiration of the applicable statute of limitation. For the years ended December 31, 2011, 2010 and 2009, the Company did not record any uncertain tax positions.
Asset Retirement Obligations
ASC 410, “Asset Retirement and Environmental Obligation,” requires an entity to recognize a liability for a conditional asset retirement obligation when incurred if the liability can be reasonably estimated. ASC 410-20-20 clarifies that the term “Conditional Asset Retirement Obligation” refers to a legal obligation (pursuant to existing laws or by contract) to perform an asset retirement activity in which the timing and/or method of settlement are conditional on a future event that may or may not be within the control of the entity. ASC 410-20-25-6 clarifies when an entity would have sufficient information to reasonably estimate the fair value of an asset retirement obligation. The Company has accrued a liability and corresponding increase to the cost of the related properties for disposal related to all properties constructed prior to 1985 that have, or may have, asbestos present in the building. The liabilities are accreted over the life of the leases for the respective properties. There was $70 and $615 in liabilities accrued in connection with acquisitions during the years ended December 31, 2011 and 2010, respectively. No such liabilities were accrued for the year ended December 31, 2009, as no acquisitions were made during 2009. The Company also recorded expenses of $156, $143 and $144 during the years ended December 31, 2011, 2010 and 2009 respectively, related to the cumulative accretion of the obligation, which is included in general and administrative expense in the consolidated statements of operations. Costs of future expenditures for obligations are discounted to their present value. The aggregate undiscounted obligation on all properties is $8.5 million and the discount rates used in the calculations range from 2.5% to 7.6%. The Company does not expect to make any payments in conjunction with these obligations in each of the next five years.
74
Stock Issuance Costs
The Company accounts for stock issuance costs in accordance with SEC Staff Accounting Bulletin (“SAB”) Topic 5.A, which states that incremental costs directly attributable to a proposed or actual offering of securities may properly be deferred and charged against the gross proceeds of the offering. Accordingly, the Company records costs incurred related to its ongoing equity offerings to other assets on its consolidated balance sheet and ratably applies these amounts to the cost of equity as stock is issued. If an equity offering is subsequently terminated and there are amounts remaining in other assets that have not been allocated to the cost of the offering, the remaining amounts are recorded as an expense on the consolidated statement of operations.
Other Income
The Company records non-operating and unusual or infrequently earned income as other income on its consolidated statement of operations. Accordingly, the Company recorded the $3.3 million of prepayment fees it received in connection with the early payment of its mortgage loan in 2010 as other income.
Real Estate Held for Sale and Discontinued Operations
ASC 360-10, “Property, Plant, and Equipment,” requires that the results of operations of any properties which have been sold, or are held for sale, be presented as discontinued operations in the Company’s consolidated financial statements in both current and prior periods presented. Income items related to held for sale properties are listed separately on the Company’s consolidated income statement. Real estate assets held for sale are measured at the lower of the carrying amount or the fair value, less the cost to sell, and are listed separately on the Company’s consolidated balance sheet. Once properties are listed as held for sale, no further depreciation is recorded.
Comprehensive Income
For the years ended December 31, 2011, 2010 and 2009, comprehensive income equaled net income; therefore, a separate statement of comprehensive income is not included in the accompanying Consolidated Financial Statements.
2. Related-Party Transactions
The Company is externally managed pursuant to contractual arrangements with its Adviser and Gladstone Administration, LLC (the “Administrator”), which collectively employ all of the Company’s personnel and pay their salaries, benefits, and general expenses directly. The Company has an advisory agreement with its Adviser (the “Advisory Agreement”) and an administration agreement with its Administrator (the “Administration Agreement”). The management services and administrative fees under the Advisory and Administration Agreements are described below. $1,188 and $965 were due to the Adviser as of December 31, 2011 and December 31, 2010, respectively.
Advisory Agreement
The Advisory Agreement provides for an annual base management fee equal to 2% of the Company’s total stockholders’ equity, less the recorded value of any preferred stock (“common stockholders’ equity”), and an incentive fee based on funds from operations (“FFO”). For the years ended December 31, 2011, 2010 and 2009 the Company recorded a base management fee of $1,629, $1,199 and $1,401, respectively. The Advisor’s Board of Directors voted to give the Company a voluntary and irrevocable credit to the base management fee for the year ended December 31, 2010 of $225. This credit may not be recouped by the Adviser in the future.
75
For purposes of calculating the incentive fee, FFO includes any realized capital gains and capital losses, less any distributions paid on preferred stock and senior common stock, but FFO does not include any unrealized capital gains or losses. The incentive fee rewards the Adviser if the Company’s quarterly FFO, before giving effect to any incentive fee (“pre-incentive fee FFO”), exceeds 1.75%, or 7% annualized (the “hurdle rate”), of total common stockholders’ equity. The Adviser receives 100% of the amount of the pre-incentive fee FFO that exceeds the hurdle rate, but is less than 2.1875% of the Company’s common stockholders’ equity. The Adviser also receives an incentive fee of 20% of the amount of the Company’s pre-incentive fee FFO that exceeds 2.1875% of common stockholders’ equity.
For the years ended December 31, 2011, 2010 and 2009 the Company recorded an incentive fee of $3,398, $3,480 and $3,239, respectively, offset by a credit related to an unconditional, voluntary and irrevocable waiver issued by the Adviser of $2,113, $158 and $726, respectively, resulting in a net incentive fee for the years ended December 31, 2011, 2010 and 2009 of $1,285, $3,322 and $2,513, respectively. The Board of Directors of the Company accepted the Adviser’s offer to waive on a quarterly basis a portion of the incentive fee for the years ended December 31, 2011, 2010 and 2009 in order to support the current level of distributions to the Company’s stockholders. This waiver may not be recouped by the Adviser in the future.
Administration Agreement
Pursuant to the Administration Agreement, the Company pays for its allocable portion of the Administrator’s overhead expenses in performing its obligations to the Company, including, but not limited to, rent and the salaries and benefits of its personnel, including its chief financial officer, chief compliance officer, internal counsel, treasurer, investor relations and their respective staffs. The Company’s allocable portion of expenses is derived by multiplying the Administrator’s total allocable expenses by the percentage of the Company’s total assets at the beginning of each quarter in comparison to the total assets of all companies managed by the Adviser under similar agreements. For the years ended December 31, 2011, 2010 and 2009, the Company recorded an administration fee of $1,024, $1,063 and $1,016, respectively.
Dealer Manager Agreement
In connection with the offering of the Company’s Senior Common Stock (see Note 8, “Stockholders’ Equity,” for further details) the Company entered into a Dealer Manager Agreement, dated March 25, 2011 (the “Dealer Manager Agreement”), with Gladstone Securities, LLC (the “Dealer Manager”), pursuant to which the Dealer Manager agreed to act as the Company’s exclusive dealer manager in connection with the offering. The Dealer Manager is an affiliate of the Company, as its parent company is controlled by Mr. David Gladstone, the Company’s Chairman and Chief Executive Officer. Pursuant to the terms of the Dealer Manager Agreement, the Dealer Manager is entitled to receive a sales commission in the amount of 7.0% of the gross proceeds of the shares of senior common stock sold, plus a dealer manager fee in the amount of 3.0% of the gross proceeds of the shares of Senior Common Stock sold. The Dealer Manager, in its sole and absolute discretion, may re-allocate all of its selling commissions attributable to a participating broker-dealer and may also re-allocate a portion of its Dealer Manager fee earned in respect of the proceeds generated by the participating broker-dealer to any participating broker-dealer as a non-accountable marketing allowance. In addition, the Company has agreed to indemnify the Dealer Manager against various liabilities, including certain liabilities arising under the federal securities laws. The company made $5 of payments during 2011 to the Dealer Manager pursuant to this agreement.
3. Earnings per Share of Common Stock
The following tables set forth the computation of basic and diluted earnings per share of common stock for the years ended December 31, 2011, 2010 and 2009. The Company computed basic earnings per share for the years ended December 31, 2011, 2010 and 2009 using the weighted average number of shares outstanding during the periods. Diluted earnings per share for the years ended December 31, 2011, 2010 and 2009, reflects additional shares of common stock, related to our convertible senior common stock, that would have been outstanding if dilutive potential shares of common stock had been issued, as well as an adjustment to net income available to common stockholders as applicable to common stockholders that would result from their assumed issuance.
76
| For the year ended December 31, | ||||||||||||
| 2011 | 2010 | 2009 | ||||||||||
| Calculation of basic earnings per share of common stock: |
||||||||||||
| Net income available to common stockholders |
$ | 1,558 | $ | 814 | $ | 509 | ||||||
| Denominator for basic weighted average shares of common stock (in thousands) |
10,237 | 8,576 | 8,563 | |||||||||
|
|
|
|
|
|
|
|||||||
| Basic earnings per share of common stock |
$ | 0.15 | $ | 0.09 | $ | 0.06 | ||||||
|
|
|
|
|
|
|
|||||||
| Calculation of diluted earnings per share of comon stock: |
||||||||||||
| Net income available to common stockholders |
$ | 1,558 | $ | 814 | $ | 509 | ||||||
| Add: Income impact of assumed conversion of senior common stock |
62 | 20 | — | |||||||||
|
|
|
|
|
|
|
|||||||
| Net income available to common stockholders plus assumed conversions |
$ | 1,620 | $ | 834 | $ | 509 | ||||||
| Denominator for basic weighted average shares of common stock (in thousands) |
10,237 | 8,576 | 8,563 | |||||||||
| Effect of convertible senior common stock |
52 | 25 | — | |||||||||
|
|
|
|
|
|
|
|||||||
| Denominator for diluted weighted average shares of common stock (in thousands) |
10,289 | 8,601 | 8,563 | |||||||||
|
|
|
|
|
|
|
|||||||
| Diluted earnings per share of common stock |
$ | 0.15 | $ | 0.09 | $ | 0.06 | ||||||
|
|
|
|
|
|
|
|||||||
4. Real Estate and Intangible Assets
Real Estate
The following table sets forth the components of the Company’s investments in real estate, including capitalized leases, as of December 31, 2011 and December 31, 2010:
| December 31, 2011 | December 31, 2010 | |||||||
| Real estate: |
||||||||
| Land |
$ | 60,602 | $ | 55,158 | (1) | |||
| Building and improvements |
367,605 | 335,576 | ||||||
| Tenant improvements |
14,314 | 10,283 | ||||||
| Accumulated depreciation |
(53,784 | ) | (43,659 | ) | ||||
|
|
|
|
|
|||||
| Real estate, net |
$ | 388,737 | $ | 357,358 | ||||
|
|
|
|
|
|||||
| (1) | Includes land held under a capital lease carried at $1,100. |
During the year ended December 31, 2011, the Company acquired seven properties, which are summarized below:
| Location |
Acquisition Date | Square Footage | Lease Term |
Renewal Options | Total Purchase Price |
Acquistion Expenses |
Debt Issued/Assumed |
Annualized Straight Line Rent |
||||||||||||||||||||||||
| Hickory, NC |
4/4/2011 | 60,000 | 9 years | 2 (5 years each) | $ | 10,650 | $ | 59 | N/A | $ | 1,045 | |||||||||||||||||||||
| Springfield, MO |
6/20/2011 | 78,421 | 10 years | 3 (5 years each) | 15,850 | 55 | 11,584 | 1,422 | ||||||||||||||||||||||||
| Boston Heights, OH |
10/20/2011 | 25,000 | 10 years | 3 (3 years each) | 4,375 | 56 | N/A | 377 | ||||||||||||||||||||||||
| Parsippany, NJ |
10/28/2011 | 60,111 | 15 years | 1 (3 years) | 11,075 | 390 | 7,200 | 1,112 | ||||||||||||||||||||||||
| Dartmouth, MA |
(1 | ) | 11/18/2011 | 16,340 | 75 years | N/A | 5,802 | 56 | 4,352 | 414 | ||||||||||||||||||||||
| Springfield, MO |
(2 | ) | 12/13/2011 | 14,560 | 62 years | N/A | 2,650 | 42 | N/A | 221 | ||||||||||||||||||||||
| Pittsburgh, PA |
12/28/2011 | 26,080 | 15 years | 2 (5 years each) | 4,200 | 140 | N/A | 400 | ||||||||||||||||||||||||
| (1) | Tenant has the right to terminate the lease every 5 years in years 26-75. |
| (2) | Tenant has the right to terminate the lease every 5 years in years 19-62. |
77
In accordance with ASC 805, the Company determined the fair value of acquired assets and liabilities assumed related to the seven properties acquired during the year ended December 31, 2011 as follows:
| Land | Building | Tenant Improvements |
In-place Leases |
Leasing Costs |
Customer Relationships |
Above Market Leases |
Below Market Leases |
Premium on Assumed Debt |
Total Purchase Price |
|||||||||||||||||||||||||||||||
| Hickory, North Carolina |
$ | 1,163 | $ | 5,567 | $ | 1,038 | $ | 736 | $ | 559 | $ | 616 | $ | 971 | $ | — | $ | — | $ | 10,650 | ||||||||||||||||||||
| Springfield, Missouri (1) |
1,700 | 11,626 | 413 | 1,174 | 572 | 702 | — | — | (337 | ) | 15,850 | |||||||||||||||||||||||||||||
| Boston Heights, Ohio |
449 | 2,405 | 605 | 399 | 229 | 288 | — | — | — | 4,375 | ||||||||||||||||||||||||||||||
| Parsippany, New Jersey |
1,696 | 5,980 | 1,070 | 1,053 | 1,103 | 746 | — | (573 | ) | — | 11,075 | |||||||||||||||||||||||||||||
| Dartmouth, Massachusetts |
— | 4,085 | 150 | 671 | 913 | 8 | — | (25 | ) | — | 5,802 | |||||||||||||||||||||||||||||
| Springfield, Missouri |
— | 2,228 | 47 | 259 | 307 | 111 | — | (302 | ) | — | 2,650 | |||||||||||||||||||||||||||||
| Pittsburgh, Pennsylvania |
281 | 2,896 | 267 | 359 | 255 | 142 | — | — | — | 4,200 | ||||||||||||||||||||||||||||||
|
|
|
|
|
|
|
|
|
|
|
|
|
|
|
|
|
|
|
|
|
|||||||||||||||||||||
| $ | 5,289 | $ | 34,787 | $ | 3,590 | $ | 4,651 | $ | 3,938 | $ | 2,613 | $ | 971 | $ | (900 | ) | $ | (337 | ) | $ | 54,602 | |||||||||||||||||||
|
|
|
|
|
|
|
|
|
|
|
|
|
|
|
|
|
|
|
|
|
|||||||||||||||||||||
| (1) | The Company paid $4.3 million in cash for this property, the remaining $11.6 million was funded with the assumed mortgaged debt. |
Below is a summary of the total revenue and net income recognized on each of the seven properties acquired during the year ended December 31, 2011:
| Location |
Acquisition Date | Rental revenue for the year ended December 31, 2011 |
Net income for the year ended December 31, 2011(1) |
|||||||||
| Hickory, NC |
4/4/2011 | $ | 693,359 | $ | 309,574 | |||||||
| Springfield, MO |
6/20/2011 | 754,670 | 485,824 | |||||||||
| Boston Heights, OH |
10/20/2011 | 73,928 | 30,947 | |||||||||
| Parsippany, NJ |
10/28/2011 | 203,933 | 123,934 | |||||||||
| Dartmouth, MA |
11/18/2011 | 74,124 | 18,326 | |||||||||
| Springfield, MO |
12/13/2011 | 16,106 | 5,609 | |||||||||
| Pittsburgh, PA |
12/28/2011 | 4,296 | 2,346 | |||||||||
| (1) | Does not include interest expense or acquisition related costs that are required to be expensed under ASC 805. |
The weighted average amortization period for the intangible assets acquired and liabilities assumed during the year ended December 31, 2011, were as follows:
| Intangible assets |
Years | |||
| In-place leases |
16.4 | |||
| Leasing costs |
16.4 | |||
| Customer relationships |
19.2 | |||
| Above market leases |
8.8 | |||
| Below market leases |
20.9 | |||
|
|
|
|||
| All intangible assets |
17.1 | |||
|
|
|
|||
Future operating lease payments from tenants under non-cancelable leases, excluding tenant reimbursement of expenses as of December 31, 2011, for each of the five succeeding fiscal years and thereafter is as follows:
| Year |
Tenant Lease Payments |
|||
| 2012 |
$ | 44,948 | ||
| 2013 |
40,579 | |||
| 2014 |
36,536 | |||
| 2015 |
32,573 | |||
| 2016 |
28,143 | |||
| Thereafter |
197,939 | |||
78
In accordance with the lease terms, substantially all tenant expenses are required to be paid by the tenant; however, the Company would be required to pay property taxes on the respective properties, and ground lease payments on its three properties that are on a ground lease, in the event the tenants fail to pay them. The total annualized property taxes for all properties owned by the Company at December 31, 2011 were $7,284, and the total annual ground lease payments were $411.
On January 31, 2011, the Company extended the lease with its tenant occupying its properties located in Decatur, Georgia, Lawrenceville, Georgia, Snellville, Georgia, Covington, Georgia, and Conyers, Georgia. The lease covering all of these properties was extended for an additional five year period, thereby extending the lease until December 2031. The lease was originally set to expire in December 2026. The lease provides for prescribed rent escalations over the life of the lease, with annualized straight line rents of $1,616. Furthermore, the lease grants the tenant four options to extend the lease for a period of five years each. In connection with the extension of the lease and the modification of certain terms under the lease, the tenant paid $750 to the Company. This lease modification fee was recorded to deferred rent liability in the consolidated balance sheet and is being amortized to rental income over the life of the lease.
On May 15, 2011, the Company re-leased its previously vacant building located in South Hadley, Massachusetts for a period of six months, and the tenant had a three-month extension option. . In February 2012, the tenant signed a new lease with a term expiring in January 2013, with a one-year extension option.
On June 23, 2011, the Company extended the lease with its tenant occupying its properties located in Angola, Indiana and Rock Falls, Illinois. The lease covering these properties was extended for an additional three year period, thereby extending the lease until August 2023. The lease provides for prescribed rent escalations over the life of the lease, with annualized straight line rents of $345. Furthermore, the lease grants the tenant three options to extend the lease for a period of five years each. In connection with the extension of the lease and the modification of certain terms under the lease, the Company provided a tenant allowance of $150, payable over a one year period.
Intangible Assets
The following table summarizes the carrying value of intangible assets and the accumulated amortization for each intangible asset class:
| December 31, 2011 | December 31, 2010 | |||||||||||||||
| Lease Intangibles | Accumulated Amortization |
Lease Intangibles | Accumulated Amortization |
|||||||||||||
| In-place leases |
$ | 24,620 | $ | (10,181 | ) | $ | 17,011 | $ | (8,362 | ) | ||||||
| Leasing costs |
15,013 | (5,663 | ) | 10,764 | (4,685 | ) | ||||||||||
| Customer relationships |
20,725 | (6,844 | ) | 17,636 | (5,617 | ) | ||||||||||
|
|
|
|
|
|
|
|
|
|||||||||
| $ | 60,358 | $ | (22,688 | ) | $ | 45,411 | $ | (18,664 | ) | |||||||
|
|
|
|
|
|
|
|
|
|||||||||
The estimated aggregate amortization expense for each of the five succeeding fiscal years and thereafter is as follows:
| Year |
Estimated Amortization Expense |
|||
| 2012 |
7,308 | |||
| 2013 |
3,831 | |||
| 2014 |
3,546 | |||
| 2015 |
3,148 | |||
| 2016 |
2,570 | |||
| Thereafter |
17,267 | |||
79
5. Real Estate Held for Sale and Discontinued Operations
As of June 30, 2009, the Company classified its property in Norfolk, Virginia as held for sale under the provisions of ASC 360-10, which requires that the results of operations of any properties which have been sold, or are held for sale, be presented as discontinued operations in the Company’s consolidated financial statements in both current and prior periods presented. On July 17, 2009, the Company sold this property for $1,200, and recognized a gain on the sale of approximately $160.
The table below summarizes the components of income from discontinued operations:
| For the year ended December 31, | ||||||||||||
| 2011 | 2010 | 2009 | ||||||||||
| Operating revenue |
$ | — | $ | — | $ | 56 | ||||||
| Operating expense |
— | — | (13 | ) | ||||||||
| Gain on sale of real estate |
— | — | 160 | |||||||||
|
|
|
|
|
|
|
|||||||
| Income from discontinued operations |
$ | — | $ | — | $ | 203 | ||||||
|
|
|
|
|
|
|
|||||||
6. Mortgage Note Receivable
On April 15, 2005, the Company originated a mortgage loan in the amount of $10.0 million that was collateralized by an office building located in McLean, Virginia in which the Company’s Adviser and Administrator are subtenants. The mortgage loan was originally scheduled to mature in May 2017 but, in July 2010 this mortgage was fully repaid. The Company received $3.3 million of additional income and prepayment fees in connection with the early payment, which was recorded as other income in the consolidated statement of operations.
80
7. Mortgage Notes Payable and Line of Credit
The Company’s mortgage notes payable and the Company’s line of credit (the “Line of Credit”) as of December 31, 2011 and December 31, 2010 are summarized below:
| Date of Issuance/ Assumption |
Principal Maturity Date |
Stated Interest Rate at December 31, 2011 (1) |
Principal Balance Outstanding | |||||||||||||||||
| December 31, 2011 | December 31, 2010 | |||||||||||||||||||
| Fixed-Rate Mortgage Notes Payable: |
||||||||||||||||||||
| 09/15/08 | 10/01/12 | (2) | 4.76 | % | $ | 45,233 | $ | 48,015 | ||||||||||||
| 02/21/06 | 12/01/13 | 5.91 | % | 8,845 | 9,022 | |||||||||||||||
| 02/21/06 | 06/30/14 | 5.20 | % | 18,345 | 18,740 | |||||||||||||||
| 08/25/05 | 09/01/15 | 5.33 | % | 20,431 | 20,771 | |||||||||||||||
| 09/12/05 | 09/01/15 | 5.21 | % | 12,019 | 12,209 | |||||||||||||||
| 12/21/05 | 12/08/15 | 5.71 | % | 18,448 | 18,728 | |||||||||||||||
| 09/06/07 | 12/11/15 | 5.81 | % | 4,219 | 4,292 | |||||||||||||||
| 03/29/06 | 04/01/16 | 5.92 | % | 16,871 | 17,000 | |||||||||||||||
| 04/27/06 | 05/05/16 | 6.58 | % | 13,409 | 13,720 | |||||||||||||||
| 08/29/08 | 06/01/16 | 6.80 | % | 6,019 | 6,162 | |||||||||||||||
| 06/20/11 | 06/30/16 | 6.08 | % | 11,505 | — | |||||||||||||||
| 11/22/06 | 12/01/16 | 5.76 | % | 13,761 | 13,954 | |||||||||||||||
| 12/22/06 | 01/01/17 | 5.79 | % | 21,037 | 21,330 | |||||||||||||||
| 02/08/07 | 03/01/17 | 6.00 | % | 13,775 | 13,775 | |||||||||||||||
| 06/05/07 | 06/08/17 | 6.11 | % | 14,240 | 14,240 | |||||||||||||||
| 10/15/07 | 11/08/17 | 6.63 | % | 15,278 | 15,474 | |||||||||||||||
| 11/18/11 | 11/01/18 | 4.50 | % | 4,352 | — | |||||||||||||||
| 12/06/11 | 12/06/19 | 6.00 | % | 8,500 | — | |||||||||||||||
| 10/28/11 | 11/01/21 | 6.00 | % | 7,190 | — | |||||||||||||||
| 12/15/10 | 12/10/26 | 6.63 | % | 10,402 | 10,795 | |||||||||||||||
| 03/16/05 | 04/01/30 | 6.33 | % | 2,314 | 2,642 | |||||||||||||||
|
|
|
|
|
|||||||||||||||||
| Contractual Fixed-Rate Mortgage Notes Payable: |
$ | 286,193 | $ | 260,869 | ||||||||||||||||
|
|
|
|
|
|||||||||||||||||
| Premiums and Discounts, net: |
(843 | ) | (1,274 | ) | ||||||||||||||||
|
|
|
|
|
|||||||||||||||||
| Total Fixed-Rate Mortgage Notes Payable: |
$ | 285,350 | $ | 259,595 | ||||||||||||||||
|
|
|
|
|
|||||||||||||||||
| Variable-Rate Line of Credit: |
12/28/10 | 12/27/13 | LIBOR +2.75 | % | $ | 18,700 | $ | 27,000 | ||||||||||||
|
|
|
|
|
|||||||||||||||||
| Total Mortgage Notes Payable and Line of Credit |
$ | 304,050 | $ | 286,595 | ||||||||||||||||
|
|
|
|
|
|||||||||||||||||
| (1) | The weighted average interest rate on all debt outstanding at December 31, 2011 was approximately 5.56%. |
| (2) | This note has one annual extension option remains, which gives the Company the ability to extend the term of the note until October 1, 2013. |
Mortgage Notes Payable
As of December 31, 2011, the Company had 21 fixed-rate mortgage notes payable, collateralized by a total of 59 properties. The parent company has limited recourse liabilities that could result from any one or more of the following circumstances: a borrower voluntarily filing for bankruptcy, improper conveyance of a property, fraud or material misrepresentation, misapplication or misappropriation of rents, security deposits, insurance proceeds or condemnation proceeds, or physical waste or damage to the property resulting from a borrower’s gross negligence or willful misconduct. The Company will also indemnify lenders against claims resulting from the presence of hazardous substances or activity involving hazardous substances in violation of environmental laws on a property. The weighted-average interest rate on the mortgage notes payable as of December 31, 2011 was 5.70%.
The Company had $45,233 of balloon principal payments maturing under one of its long-term mortgages in 2011; however, the mortgage has two annual extension options through 2013, and the Company exercised one of these options on September 30, 2011. In connection with the exercise of the option, the interest rate reset from 4.58% to 4.76% through September 30, 2012. At the time of notification of the extension, the
81
Company remitted a fee of 0.25% of the outstanding principal balance, or approximately $113, which is recorded as a deferred financing cost in the Company’s consolidated balance sheet. The Company also remitted a certification to the lender that its aggregate debt service coverage ratio is not less than 1.2, thus the Company was in compliance with all covenants under the mortgage loan. The interest rate for the one additional extension period will adjust based upon the one-year swap rate at the time of extension and a fixed spread of 4.41% and the Company would be required to remit another fee of 0.25% of the current outstanding principal balance
The fair value of all fixed-rate mortgage notes payable outstanding as of December 31, 2011 was $276,246, as compared to the carrying value stated above of $286,193. The fair value is calculated based on a discounted cash flow analysis, using interest rates based on management’s estimate of market interest rates on long-term debt with comparable terms.
On June 20, 2011, we assumed approximately $11,584 of indebtedness pursuant to a long-term note payable from PNC Bank, in connection with the Company’s acquisition, on the same date, of a property located in Springfield, Missouri. The note accrues interest at a rate of 6.08% per year, and we may not repay this note prior to the last two months of the term, or we would be subject to a substantial prepayment penalty. The note matures on June 30, 2016.
On October 28, 2011, we borrowed $7,200 pursuant to a long-term note payable from The Provident Bank, which is collateralized by a security interest in our Parsippany, New Jersey property, which we acquired on the same date. The note accrues interest at a rate of 6.00% per year and we may not repay this note prior to the last two years of the term, or we would be subject to a substantial prepayment penalty. The note has a maturity date of November 1, 2021.
On November 18, 2011, we borrowed $4,352 pursuant to a long-term note payable from Liberty Bank, which is collateralized by a security interest in our Dartmouth, Massachusetts property, which we acquired on the same date. The note accrues interest at a rate of 4.50% per year and we may not repay this note prior to the last three months of the term, or we would be subject to a substantial prepayment penalty. The note has a maturity date of November 1, 2018, with a three year extension period through November 1, 2021.
On December 6, 2011, we borrowed $8,500 pursuant to a long-term note payable from Great Southern Bank, which is collateralized by a security interest in our Tulsa, Oklahoma property. The note accrues interest for the first five years at a rate of 6.00% per year, after the fifth year the rate is based on the prime rate, with a floor of 6.00%. A portion of this note, $2,000, is full recourse to the Company. We may not repay this note prior to December 6, 2015, or we would be subject to a substantial prepayment penalty. The note has a maturity date of December 6, 2019.
Scheduled principal payments of mortgage notes payable as of December 31, 2011 for each of the five succeeding fiscal years and thereafter are as follows:
| Year |
Scheduled principal payments |
|||
| 2012 |
$ | 49,631 | (1) | |
| 2013 |
13,263 | |||
| 2014 |
21,937 | |||
| 2015 |
55,809 | |||
| 2016 |
59,406 | |||
| Thereafter |
86,147 | |||
|
|
|
|||
| $ | 286,193 | |||
|
|
|
|||
| (1) | The $45.2 million mortgage note issued in September 2008 was extended on September 30, 2011 for an additional year. The Company expects to exercise the additional option to extend the maturity date until October 2013. |
82
Line of Credit
In December 2010, the Company procured a $50,000 Line of Credit (with Capital One, N.A. serving as a revolving lender, a letter of credit issuer and an administrative agent and Branch Banking and Trust Company serving as a revolving lender and a letter of credit issuer), which matures on December 28, 2013. The Line of Credit originally provided for a senior secured revolving credit facility of up to $50,000 with a standby letter of credit sublimit of up to $20,000. In January 2012, the Line of Credit was expanded to $75,000; see Note 11 “Subsequent Events,” for further details. Currently, ten of the Company’s properties are pledged as collateral under its Line of Credit. The interest rate per annum applicable to the Line of Credit is equal to the London Interbank Offered Rate, or LIBOR, plus an applicable margin of up to 3.00%, depending upon the Company’s leverage. The leverage ratio used in determining the applicable margin for interest on the Line of Credit is recalculated quarterly. The Company is subject to an annual maintenance fee of 0.25% per year. The Company’s ability to access this source of financing is subject to its continued ability to meet customary lending requirements, such as compliance with financial and operating covenants and its meeting certain lending limits. One such covenant requires the Company to limit distributions to its stockholders to 95% of our FFO, with acquisition-related costs required to be expensed under ASC 805 added back to FFO. In addition, the maximum amount the Company may draw under this agreement is based on a percentage of the value of properties pledged as collateral to the banks, which must meet agreed upon eligibility standards.
If and when long-term mortgages are arranged for these pledged properties, the banks will release the properties from the Line of Credit and reduce the availability under the Line of Credit by the advanced amount of the released property. Conversely, as the Company purchases new properties meeting the eligibility standards, it may pledge these new properties to obtain additional availability under this agreement. The availability under the Line of Credit will also be reduced by letters of credit used in the ordinary course of business. The Company may use the advances under the Line of Credit for both general corporate purposes and the acquisition of new investments.
At December 31, 2011, there was $18,700 outstanding under the Line of Credit at an interest rate of 3.0% and $5,550 outstanding under letters of credit at a weighted average interest rate of 2.75%. At December 31, 2011, the maximum amount the Company may draw was $35,686, leaving a remaining borrowing capacity available under the Line of Credit of $11,436. The Company was in compliance with all covenants under the Line of Credit as of December 31, 2011. The amount outstanding on the Line of Credit as of December 31, 2011 approximates fair value, because the debt is short-term.
8. Stockholders’ Equity
Distributions
The Company’s Board of Directors declared the following distributions per share for the years ended December 31, 2011, 2010 and 2009:
| 2011 | For the year ended December 31, 2010 |
2009 | ||||||||||
| Common Stock |
$ | 1.500 | $ | 1.500 | $ | 1.500 | ||||||
| Senior Common Stock |
$ | 1.0500 | $ | 0.7875 | $ | — | ||||||
| Series A Preferred Stock |
$ | 1.9374996 | $ | 1.9374996 | $ | 1.9374996 | ||||||
| Series B Preferred Stock |
$ | 1.8750 | $ | 1.8750 | $ | 1.8750 | ||||||
83
For federal income tax purposes, distributions paid to stockholders may be characterized as ordinary income, capital gains, return of capital or a combination of the foregoing. There were no capital gains during the last 3 years. The characterization of distributions during each of the last three years is reflected in the table below:
| Ordinary Income | Return of Capital | |||||||
| Common Stock |
||||||||
| For the year ended December 31, 2009 |
6.04080 | % | 93.95920 | % | ||||
| For the year ended December 31, 2010 |
15.76540 | % | 84.23460 | % | ||||
| For the year ended December 31, 2011 |
16.62560 | % | 83.37440 | % | ||||
| Senior Common Stock |
||||||||
| For the year ended December 31, 2009 |
N/A | N/A | (1) | |||||
| For the year ended December 31, 2010 |
100.00000 | % | 0.00000 | % | ||||
| For the year ended December 31, 2011 |
100.00000 | % | 0.00000 | % | ||||
| Series A Preferred Stock |
||||||||
| For the year ended December 31, 2009 |
100.00000 | % | 0.00000 | % | ||||
| For the year ended December 31, 2010 |
100.00000 | % | 0.00000 | % | ||||
| For the year ended December 31, 2011 |
100.00000 | % | 0.00000 | % | ||||
| Series B Preferred Stock |
||||||||
| For the year ended December 31, 2009 |
100.00000 | % | 0.00000 | % | ||||
| For the year ended December 31, 2010 |
100.00000 | % | 0.00000 | % | ||||
| For the year ended December 31, 2011 |
100.00000 | % | 0.00000 | % | ||||
| (1) | There was no Senior Common Stock outstanding during the year ended December 31, 2009. |
Recent Activity
On February 2, 2011, the Company sold 725,000 shares of its common stock at $18.35 per share in an underwritten public offering of its common stock. The Company also granted the underwriters a 30-day option to purchase up to 108,750 shares of common stock on the same terms and conditions to cover over-allotments. On February 11, 2011, the underwriters exercised their option to purchase an additional 108,750 shares of common stock. The net proceeds, including the over-allotment, after deducting the underwriting discount and offering expenses were $14,325. The Company used the proceeds of the offering to repay a portion of the outstanding balance under its Line of Credit and for general corporate purposes.
On June 15, 2011, the Company sold 1,200,000 shares of its common stock at $17.55 per share in an underwritten public offering of its common stock. The Company also granted the underwriters a 30-day option to purchase up to 180,000 shares of common stock on the same terms and conditions to cover over- allotments. On July 6, 2011, the underwriters exercised their option to purchase an additional 174,000 shares of common stock. The net proceeds, including the over-allotment, after deducting the underwriting discount and offering expenses were $22,705. The Company used the proceeds of the offering to repay a portion of the outstanding balance under its Line of Credit and for general corporate purposes.
The Company has an open market sale agreement, or the Open Market Sale Agreement, with Jefferies & Company, Inc., or Jefferies, under which it may, from time to time, offer to sell shares of its common stock with an aggregate sales price of up to $25,000 on the open market through Jefferies, as agent, or to Jefferies, as principal. As of December 31, 2011, the Company had sold 192,365 shares with net proceeds of $3,400, and has a remaining capacity to sell up to $21,600 of common stock under the Open Market Sale Agreement with Jefferies. The program was not utilized during 2011.
In March 2011, the Company commenced an offering of an aggregate of 3,500,000 shares of its senior common stock, par value $0.001 per share, at a price to the public of $15.00 per share, of which 3,000,000 shares are intended to be offered pursuant to the primary offering and 500,000 shares are intended to be offered pursuant to the Company’s senior common distribution reinvestment plan (the “DRIP”). The Company, however, reserves the right to reallocate the number of shares being offered between the primary offering and the DRIP. To date the Company has sold 11,933 shares of senior common stock in this ongoing offering.
84
Notes to Employees
The following table is a summary of all outstanding notes issued to employees of the Adviser for the exercise of stock options:
| Date Issued |
Number of Options Exercised |
Strike Price of Options Exercised |
Amount of Promissory Note Issued to Employees |
Outstanding Balance of Employee Loans at December 31, 2011 |
Outstanding Balance of Employee Loans at December 31, 2010 |
Maturity Date of Note |
Interest Rate on Note |
|||||||||||||||||||||
| Sep 2004 |
25 | $ | 15.00 | $ | 375 | $ | 11 | $ | 20 | Sep 2013 | 5.00 | % | ||||||||||||||||
| Apr 2006 |
12 | 16.10 | 193 | 4 | 5 | Apr 2015 | 7.77 | % | ||||||||||||||||||||
| May 2006 |
50 | 16.85 | 843 | — | 531 | May 2016 | 7.87 | % | ||||||||||||||||||||
| May 2006 |
2 | 16.10 | 32 | 32 | 32 | May 2016 | 7.87 | % | ||||||||||||||||||||
| Nov 2006 |
25 | 15.00 | 375 | 375 | 375 | Nov 2015 | 8.15 | % | ||||||||||||||||||||
|
|
|
|
|
|
|
|
|
|||||||||||||||||||||
| 114 | $ | 1,818 | $ | 422 | $ | 963 | ||||||||||||||||||||||
|
|
|
|
|
|
|
|
|
|||||||||||||||||||||
In accordance with ASC 505-10-45-2, “Equity,” receivables from employees for the issuance of capital stock to employees prior to the receipt of cash payment should be reflected in the balance sheet as a reduction to stockholders’ equity. Therefore, these notes were recorded as full recourse loans to employees and are included in the equity section of the accompanying consolidated balance sheets. As of December 31, 2011, each loan maintained its full recourse status.
9. Pro Forma Financial Information (unaudited)
The Company acquired seven properties during the year ended December 31, 2011. The following table reflects pro-forma condensed consolidated statements of operations as if the properties were acquired as of the beginning of the periods presented:
| For the year ended December 31, | ||||||||||||
| 2011 | 2010 | 2009 | ||||||||||
| Operating Data: |
||||||||||||
| Total operating revenue |
$ | 47,456 | $ | 47,233 | $ | 47,971 | ||||||
| Total operating expenses |
(23,544 | ) | (26,829 | ) | (23,968 | ) | ||||||
| Other expense |
(18,054 | ) | (15,251 | ) | (19,174 | ) | ||||||
|
|
|
|
|
|
|
|||||||
| Net income |
5,858 | 5,153 | 4,829 | |||||||||
| Dividends attributable to preferred and senior common stock |
(4,156 | ) | (4,114 | ) | (4,094 | ) | ||||||
|
|
|
|
|
|
|
|||||||
| Net income available to common stockholders |
$ | 1,702 | $ | 1,039 | $ | 735 | ||||||
|
|
|
|
|
|
|
|||||||
| Share and Per Share Data: |
||||||||||||
| Basic earnings per share of common stock |
$ | 0.17 | $ | 0.12 | $ | 0.09 | ||||||
| Diluted earnings per share of common stock |
$ | 0.17 | $ | 0.12 | $ | 0.09 | ||||||
| Weighted average shares outstanding-basic |
10,237 | 8,576 | 8,563 | |||||||||
| Weighted average shares outstanding-diluted |
10,289 | 8,601 | 8,563 | |||||||||
85
10. Quarterly Financial Information (unaudited)
The following table reflects the quarterly results of operations for the years ended December 31, 2011 and 2010.
| Quarter ended December 31, 2011 |
Quarter ended September 30, 2011 |
Quarter ended June 30, 2011 |
Quarter ended March 31, 2011 |
|||||||||||||
| Operating revenues |
$ | 11,468 | $ | 11,173 | $ | 10,816 | $ | 10,519 | ||||||||
| Operating expenses |
5,895 | 5,183 | 5,255 | 4,937 | ||||||||||||
| Other expense |
(4,457 | ) | (4,242 | ) | (4,191 | ) | (4,102 | ) | ||||||||
|
|
|
|
|
|
|
|
|
|||||||||
| Income from continuing operations |
1,116 | 1,748 | 1,370 | 1,480 | ||||||||||||
| Discontinued operations |
— | — | — | — | ||||||||||||
|
|
|
|
|
|
|
|
|
|||||||||
| Net income |
1,116 | 1,748 | 1,370 | 1,480 | ||||||||||||
| Dividends attributable to preferred and senior common stock |
(1,040 | ) | (1,039 | ) | (1,039 | ) | (1,038 | ) | ||||||||
|
|
|
|
|
|
|
|
|
|||||||||
| Net income available to common stockholders |
76 | 709 | 331 | 442 | ||||||||||||
| Net income available to common stockholders - basic |
$ | 0.01 | $ | 0.06 | $ | 0.03 | $ | 0.05 | ||||||||
| Net income available to common stockholders - diluted |
$ | 0.01 | $ | 0.06 | $ | 0.03 | $ | 0.05 | ||||||||
| Weighted average shares outstanding - basic |
10,945 | 10,936 | 9,782 | 9,258 | ||||||||||||
| Weighted average shares outstanding - diluted |
10,997 | 10,988 | 9,834 | 9,310 | ||||||||||||
| Quarter ended December 31, 2010 |
Quarter ended September 30, 2010 |
Quarter ended June 30, 2010 |
Quarter ended March 31, 2010 |
|||||||||||||
| Operating revenues |
$ | 10,228 | $ | 10,334 | $ | 10,681 | $ | 10,685 | ||||||||
| Operating expenses |
5,421 | 7,282 | 5,350 | 5,361 | ||||||||||||
| Other expense |
(3,999 | ) | (1,024 | ) | (4,325 | ) | (4,238 | ) | ||||||||
|
|
|
|
|
|
|
|
|
|||||||||
| Income from continuing operations |
808 | 2,028 | 1,006 | 1,086 | ||||||||||||
| Discontinued operations |
— | — | — | — | ||||||||||||
|
|
|
|
|
|
|
|
|
|||||||||
| Net income |
808 | 2,028 | 1,006 | 1,086 | ||||||||||||
| Dividends attributable to preferred and senior common stock |
(1,041 | ) | (1,027 | ) | (1,023 | ) | (1,023 | ) | ||||||||
|
|
|
|
|
|
|
|
|
|||||||||
| Net income available to common stockholders |
(233 | ) | 1,001 | (17 | ) | 63 | ||||||||||
| Net income available to common stockholders - basic |
$ | (0.04 | ) | $ | 0.12 | $ | 0.00 | $ | 0.01 | |||||||
| Net income available to common stockholders - diluted |
$ | (0.04 | ) | $ | 0.12 | $ | 0.00 | $ | 0.01 | |||||||
| Weighted average shares outstanding - basic |
8,638 | 8,563 | 8,545 | 8,559 | ||||||||||||
| Weighted average shares outstanding - diluted |
8,689 | 8,577 | 8,547 | 8,559 | ||||||||||||
86
11. Subsequent Events
On January 10, 2012, the Company’s Board of Directors declared the following monthly distributions:
| Record Date |
Payment Date |
Common Stock Distributions per Share |
Series A Preferred Distributions per Share |
Series B Preferred Distributions per Share |
||||||||||
| January 23, 2012 |
January 31, 2012 | $ | 0.125 | $ | 0.1614583 | $ | 0.15625 | |||||||
| February 21, 2012 |
February 29, 2012 | $ | 0.125 | $ | 0.1614583 | $ | 0.15625 | |||||||
| March 22, 2012 |
March 30, 2012 | $ | 0.125 | $ | 0.1614583 | $ | 0.15625 | |||||||
| Senior Common Stock Cash Distributions | ||||||
| Payable to the Holders or Record During the Month of: |
Payment Date |
Distribution per Share | ||||
| January |
February 7, 2012 | $ | 0.0875 | |||
| February |
March 7, 2012 | $ | 0.0875 | |||
| March |
April 9, 2012 | $ | 0.0875 | |||
On January 25, 2012, the Company acquired a 52,130 square foot office building located in Ashburn, Virginia for $10,775, excluding related acquisition expenses of $98. The Company funded this acquisition using borrowings from its Line of Credit. Independent Project Analysis, Inc, an energy consultant, is the tenant in this building and has leased the property for 15 years and has 2 options to renew the lease for additional periods of 5 years each. The lease provides for prescribed rent escalations over the life of the lease, with annualized straight line rents of $989.
On January 31, 2012, the Company amended its Line of Credit to increase the current maximum availability of credit under the Line of Credit from $50.0 million to $75.0 million. The Line of Credit was arranged by Capital One, N.A. as administrative agent, and Branch Banking and Trust Company as an additional lender. Citizens Bank of Pennsylvania joined the Line of Credit as an additional lender. All other terms of the agreement remained the same. In connection with this amendment, the Company paid a $125 amendment fee.
On February 1, 2012, the Company completed a public offering of 1.4 million shares of 7.125% Series C Term Preferred Stock, par value $0.001 per share (“Term Preferred Stock”), at a public offering price of $25.00 per share. Gross proceeds totaled $35,000 and net proceeds of the offering, after deducting underwriting discounts and offering expenses borne by the Company, were $33,400 and were used to repay a portion of outstanding borrowings under the Company’s Line of Credit and for acquistions of real estate. On February 8, 2012, the underwriters notified the Company of their intent to exercise their option to purchase an additional 140,000 shares of the Company’s Term Preferred Stock to cover over-allotments, which resulted in net proceeds, after deducting underwriting discounts, of $3,360 received by the Company on February 10, 2012, which will be used for working capital. The shares are traded under the ticker symbol GOODN on the NASDAQ. The Term Preferred Stock is not convertible into the Company’s common stock or any other security of the Company. Generally, the Company may not redeem shares of the Term Preferred Stock prior to January 31, 2016, except in limited circumstances to preserve its status as a REIT. On or after January 31, 2016, the Company may redeem the shares at a redemption price of $25 per share, plus any accumulated and unpaid dividends to and including the date of redemption. The shares of the Term Preferred Stock have a mandatory redemption date of January 31, 2017. The Term Preferred Stock will be recorded as liability in accordance with ASC 480, “Distinguishing Liabilities from Equity,” which states that mandatorily redeemable financial instruments should be classified as liabilities. On February 2, 2012, the Company declared monthly cash distributions of $0.1484375 per share on the Term Preferred Stock for each of the months of February and March 2012.
On February 1, 2012, the Company repaid in full the mortgage on its property located in Canton, North Carolina in the amount of $2,276. This mortgage note had been in hyper amortization since February of 2010 and thus the Company did not incur any prepayment penalties associated with the early repayment. The maturity date of this mortgage was April 2030.
On February 13, 2012, the Company extended the lease with the tenant occupying its property located in South Hadley, Massachusetts. The lease covering this property was extended for an additional one-year period, thereby extending the lease until January 2013. The lease was originally set to expire in February 2012. The lease provides for prescribed rent escalations over the life of the lease, with annualized straight line rents of approximately $256. Furthermore, the lease grants the tenant one option to extend the lease for an additional year.
On February 14, 2012, the Company extended the lease with the tenant occupying its property located in San Antonio, Texas. The lease covering this property was extended for an additional eight-year period, thereby extending the lease until November 2021. The lease was originally set to expire in February 2014. The lease provides for prescribed rent escalations over the life of the lease, with annualized straight line
87
rents of approximately $785. Furthermore, the lease grants the tenant two options to extend the lease for a period of five years each. In connection with the extension of the lease and the modification of certain terms under the lease, the Company provided a tenant allowance of $603, payable over two years, and paid $327 in leasing commissions.
On February 27, 2012, the Company extended the lease with the tenant occupying its property located in Roseville, Minnesota. The new lease covers approximately one-third of this property and was extended for an additional five year period, thereby extending the lease until December 2017. The lease was originally set to expire in December 2012. The tenant in this property will pay rent on the entire building through the end of 2012, and the Company continues to search for new tenants to lease the remainder of the building. The new lease provides for prescribed rent escalations over the life of the lease, with annualized straight line rents of $1,257. Furthermore, the lease grants the tenant one option to extend the lease for a period of five years. In connection with the extension of the lease and the modification of certain terms under the lease, the Company provided a tenant allowance of $413, payable over two years, and paid $767 in leasing commissions.
88
SCHEDULE REAL ESTATE AND ACCUMULATED DEPRECIATION
GLADSTONE COMMERCIAL CORPORATION
SCHEDULE III - REAL ESTATE AND ACCUMULATED DEPRECIATION
DECEMBER 31, 2011 (Dollars in Thousands)
| Initial Cost | Total Cost | |||||||||||||||||||||||||||||||||||||||
| Location of Property |
Encumbrances | Land | Buildings & Improvements |
Costs Capitalized Subsequent to Acquisition |
Land | Buildings & Improvements |
Total (1) | Accumulated Depreciation (2) |
Net Real Estate |
Date Acquired |
||||||||||||||||||||||||||||||
| Raleigh, North Carolina Office Building |
$ | 4,939 | $ | 960 | $ | 4,481 | $ | — | $ | 960 | 4,481 | $ | 5,441 | $ | 1,362 | $ | 4,079 | 12/23/2003 | ||||||||||||||||||||||
| Canton, Ohio Office & Warehouse Building |
2,816 | 186 | 3,083 | — | 186 | 3,083 | 3,269 | 697 | 2,572 | 1/30/2004 | ||||||||||||||||||||||||||||||
| Akron, Ohio Office & Laboratory Building |
7,217 | 1,973 | 6,771 | 285 | 1,973 | 7,056 | 9,029 | 1,372 | 7,657 | 4/29/2004 | ||||||||||||||||||||||||||||||
| Charlotte, North Carolina Office Building |
6,690 | 740 | 8,423 | 60 | 741 | 8,483 | 9,224 | 1,655 | 7,569 | 6/30/2004 | ||||||||||||||||||||||||||||||
| Canton, North Carolina Commercial & Manufacturing |
2,314 | 150 | 5,050 | — | 150 | 5,050 | 5,200 | 968 | 4,232 | 7/6/2004 | ||||||||||||||||||||||||||||||
| Snyder Township, Pennsylvania Commercial & Warehouse |
5,462 | 100 | 6,574 | 169 | 100 | 6,743 | 6,843 | 1,264 | 5,579 | 8/5/2004 | ||||||||||||||||||||||||||||||
| Lexington, North Carolina Commercial & Warehouse |
2,771 | 820 | 2,107 | 6 | 820 | 2,113 | 2,933 | 402 | 2,531 | 8/5/2004 | ||||||||||||||||||||||||||||||
| Austin, Texas Office Building |
6,500 | 1,000 | 6,296 | 46 | 1,000 | 6,342 | 7,342 | 1,217 | 6,125 | 9/16/2004 | ||||||||||||||||||||||||||||||
| Mt. Pocono, Pennsylvania Commercial & Manufacturing |
5,113 | 350 | 5,819 | 18 | 350 | 5,837 | 6,187 | 1,095 | 5,092 | 10/15/2004 | ||||||||||||||||||||||||||||||
| San Antonio, Texas Flexible Office Building |
6,982 | 843 | 7,514 | 22 | 843 | 7,536 | 8,379 | 1,757 | 6,622 | 2/10/2005 | ||||||||||||||||||||||||||||||
| Columbus, Ohio Industrial Building |
2,655 | 410 | 2,385 | — | 410 | 2,385 | 2,795 | 425 | 2,370 | 2/10/2005 | ||||||||||||||||||||||||||||||
| Big Flats, New York Industrial Building |
5,587 | 275 | 6,459 | 34 | 275 | 6,493 | 6,768 | 1,124 | 5,644 | 4/15/2005 | ||||||||||||||||||||||||||||||
| Wichita, Kansas Office Building |
8,129 | 1,525 | 9,703 | 67 | 1,525 | 9,770 | 11,295 | 1,756 | 9,539 | 5/18/2005 | ||||||||||||||||||||||||||||||
| Arlington, Texas Warehouse & Bakery Building |
4,008 | 636 | 3,695 | 416 | 636 | 4,111 | 4,747 | 663 | 4,084 | 5/26/2005 | ||||||||||||||||||||||||||||||
| Dayton, Ohio Office Building |
1,984 | 525 | 1,877 | 120 | 525 | 1,997 | 2,522 | 506 | 2,016 | 6/30/2005 | ||||||||||||||||||||||||||||||
| Eatontown, New Jersey Office Building |
4,545 | 1,351 | 3,520 | 403 | 1,351 | 3,923 | 5,274 | 674 | 4,600 | 7/7/2005 | ||||||||||||||||||||||||||||||
| Frankling Township, New Jersey Office & Warehouse Building |
6,739 | 1,632 | 6,200 | — | 1,632 | 6,200 | 7,832 | 1,033 | 6,799 | 7/11/2005 | ||||||||||||||||||||||||||||||
| Duncan, South Carolina Office & Warehouse Building |
11,005 | 783 | 10,790 | 1,629 | 783 | 12,419 | 13,202 | 2,023 | 11,179 | 7/14/2005 | ||||||||||||||||||||||||||||||
| Duncan, South Carolina Manufacturing Building |
2,735 | 195 | 2,682 | 405 | 195 | 3,087 | 3,282 | 503 | 2,779 | 7/14/2005 | ||||||||||||||||||||||||||||||
| Hazelwood, Missouri Office & Warehouse Building |
2,360 | 763 | 2,309 | 30 | 763 | 2,339 | 3,102 | 402 | 2,700 | 8/5/2005 | ||||||||||||||||||||||||||||||
89
GLADSTONE COMMERCIAL CORPORATION
SCHEDULE III - REAL ESTATE AND ACCUMULATED DEPRECIATION (Continued)
DECEMBER 31, 2011 (Dollars in Thousands)
| Initial Cost | Total Cost | |||||||||||||||||||||||||||||||||||||||
| Location of Property |
Encumbrances | Land | Buildings & Improvements |
Costs Capitalized Subsequent to Acquisition |
Land | Buildings & Improvements |
Total (1) | Accumulated Depreciation (2) |
Net Real Estate | Date Acquired |
||||||||||||||||||||||||||||||
| Angola, Indiana Industrial Building |
571 | 66 | 1,075 | 49 | 66 | 1,124 | 1,190 | 177 | 1,013 | 9/2/2005 | ||||||||||||||||||||||||||||||
| Angola, Indiana Industrial Building |
1,142 | 132 | 1,130 | 51 | 132 | 1,181 | 1,313 | 186 | 1,127 | 9/2/2005 | ||||||||||||||||||||||||||||||
| Rock Falls, Illinois Industrial Building |
305 | 35 | 1,113 | 50 | 35 | 1,163 | 1,198 | 183 | 1,015 | 9/2/2005 | ||||||||||||||||||||||||||||||
| Newburyport, Massachusetts Industrial Building |
6,593 | 629 | 6,504 | 1,847 | 629 | 8,351 | 8,980 | 1,219 | 7,761 | 10/17/2005 | ||||||||||||||||||||||||||||||
| Clintonville, Wisconsin Industrial Manufacturing Building |
3,263 | 55 | 4,717 | — | 55 | 4,717 | 4,772 | 768 | 4,004 | 10/31/2005 | ||||||||||||||||||||||||||||||
| Maple Heights, Ohio Industrial Building |
10,332 | 1,609 | 10,065 | 1,124 | 1,609 | 11,189 | 12,798 | 2,013 | 10,785 | 12/21/2005 | ||||||||||||||||||||||||||||||
| Richmond, Virginia Industrial Building |
5,275 | 736 | 5,336 | 36 | 736 | 5,372 | 6,108 | 878 | 5,230 | 12/30/2005 | ||||||||||||||||||||||||||||||
| Toledo, Ohio Industrial Building |
2,889 | 263 | 2,812 | 40 | 263 | 2,852 | 3,115 | 507 | 2,608 | 12/30/2005 | ||||||||||||||||||||||||||||||
| South Hadley, Massachusetts Industrial Building |
— | 471 | 2,765 | 10 | 471 | 2,775 | 3,246 | 417 | 2,829 | 2/15/2006 | ||||||||||||||||||||||||||||||
| Champaign, Illinois Office Building |
1,667 | 687 | 2,036 | 2 | 687 | 2,038 | 2,725 | 342 | 2,384 | 2/21/2006 | ||||||||||||||||||||||||||||||
| Champaign, Illinois Office Building |
3,268 | 1,347 | 3,992 | 4 | 1,347 | 3,996 | 5,343 | 670 | 4,672 | 2/21/2006 | ||||||||||||||||||||||||||||||
| Champaign, Illinois Office Building |
2,042 | 842 | 2,495 | 2 | 842 | 2,497 | 3,339 | 419 | 2,920 | 2/21/2006 | ||||||||||||||||||||||||||||||
| Champaign, Illinois Office Building |
1,868 | 770 | 2,281 | 2 | 770 | 2,283 | 3,053 | 383 | 2,670 | 2/21/2006 | ||||||||||||||||||||||||||||||
| Roseville, Minnesota Office Building |
18,345 | 2,588 | 25,290 | — | 2,588 | 25,290 | 27,878 | 4,633 | 23,245 | 2/21/2006 | ||||||||||||||||||||||||||||||
| Burnsville, Minnesota Office Building |
11,556 | 3,511 | 8,746 | — | 3,511 | 8,746 | 12,257 | 1,678 | 10,579 | 5/10/2006 | ||||||||||||||||||||||||||||||
| Menomonee Falls, Wisconsin Industrial Building |
6,940 | 625 | 6,911 | 57 | 625 | 6,968 | 7,593 | 995 | 6,598 | 6/30/2006 | ||||||||||||||||||||||||||||||
| Baytown, Texas Office Building |
2,000 | 221 | 2,443 | — | 221 | 2,443 | 2,664 | 396 | 2,268 | 7/11/2006 | ||||||||||||||||||||||||||||||
| Sterling Heights, Michigan (4) Industrial Building |
— | 2,735 | 8,606 | 13 | 2,735 | 8,619 | 11,354 | 1,166 | 10,188 | 9/22/2006 | ||||||||||||||||||||||||||||||
| Birmingham, Alabama (4) Industrial Building |
— | 612 | 2,326 | — | 612 | 2,326 | 2,938 | 321 | 2,617 | 9/29/2006 | ||||||||||||||||||||||||||||||
| Montgomery, Alabama (4) Industrial Building |
— | 222 | 844 | — | 222 | 844 | 1,066 | 116 | 950 | 9/29/2006 | ||||||||||||||||||||||||||||||
90
GLADSTONE COMMERCIAL CORPORATION
SCHEDULE III - REAL ESTATE AND ACCUMULATED DEPRECIATION (Continued)
DECEMBER 31, 2011 (Dollars in Thousands)
| Initial Cost | Total Cost | |||||||||||||||||||||||||||||||||||||||
| Location of Property |
Encumbrances | Land | Buildings & Improvements |
Costs Capitalized Subsequent to Acquisition |
Land | Buildings & Improvements |
Total (1) | Accumulated Depreciation (2) |
Net Real Estate | Date Acquired |
||||||||||||||||||||||||||||||
| Columbia, Missouri (4) Industrial Building |
— | 146 | 555 | — | 146 | 555 | 701 | 77 | 624 | 9/29/2006 | ||||||||||||||||||||||||||||||
| Mason, Ohio Office Building |
5,357 | 797 | 6,258 | 48 | 797 | 6,306 | 7,103 | 1,014 | 6,089 | 1/5/2007 | ||||||||||||||||||||||||||||||
| Raleigh, North Carolina Industrial Building |
5,401 | 1,606 | 5,513 | — | 1,606 | 5,513 | 7,119 | 707 | 6,412 | 2/16/2007 | ||||||||||||||||||||||||||||||
| Tulsa, Oklahoma Manufacturing Building |
8,500 | — | 14,057 | — | — | 14,057 | 14,057 | 2,043 | 12,014 | 3/1/2007 | ||||||||||||||||||||||||||||||
| Hialeah, Florida Industrial Building |
— | 3,562 | 6,672 | 273 | 3,562 | 6,945 | 10,507 | 844 | 9,663 | 3/9/2007 | ||||||||||||||||||||||||||||||
| Tewksbury, Massachusetts (4) |
— | 1,395 | 8,893 | — | 1,395 | 8,893 | 10,288 | 1,142 | 9,146 | 5/17/2007 | ||||||||||||||||||||||||||||||
| Mason, Ohio Retail Building |
4,764 | 1,201 | 4,961 | — | 1,201 | 4,961 | 6,162 | 580 | 5,582 | 7/1/2007 | ||||||||||||||||||||||||||||||
| Cicero, New York Industrial Building |
4,219 | 299 | 5,019 | — | 299 | 5,019 | 5,318 | 556 | 4,762 | 9/6/2007 | ||||||||||||||||||||||||||||||
| Grand Rapids, Michigan Office Building |
9,152 | 1,629 | 10,500 | — | 1,629 | 10,500 | 12,129 | 1,226 | 10,903 | 9/28/2007 | ||||||||||||||||||||||||||||||
| Bollingbrook, Illinois Industrial Building |
4,929 | 1,272 | 5,003 | — | 1,272 | 5,003 | 6,275 | 583 | 5,692 | 9/28/2007 | ||||||||||||||||||||||||||||||
| Decatur, Georgia Office Building |
3,257 | 784 | 3,245 | — | 784 | 3,245 | 4,029 | 354 | 3,676 | 12/13/2007 | ||||||||||||||||||||||||||||||
| Decatur, Georgia Office Building |
851 | 205 | 848 | — | 205 | 848 | 1,053 | 93 | 960 | 12/13/2007 | ||||||||||||||||||||||||||||||
| Decatur, Georgia Office Building |
1,068 | 257 | 1,064 | — | 257 | 1,064 | 1,321 | 116 | 1,205 | 12/13/2007 | ||||||||||||||||||||||||||||||
| Lawrenceville, Georgia Office Building |
2,820 | 679 | 2,809 | — | 679 | 2,809 | 3,488 | 307 | 3,181 | 12/13/2007 | ||||||||||||||||||||||||||||||
| Snellville, Georgia Office Building |
732 | 176 | 729 | — | 176 | 729 | 905 | 80 | 825 | 12/13/2007 | ||||||||||||||||||||||||||||||
| Covington, Georgia Office Building |
963 | 232 | 959 | — | 232 | 959 | 1,191 | 105 | 1,085 | 12/13/2007 | ||||||||||||||||||||||||||||||
| Cumming, Georgia Office Building |
3,066 | 738 | 3,055 | — | 738 | 3,055 | 3,793 | 334 | 3,459 | 12/13/2007 | ||||||||||||||||||||||||||||||
| Conyers, Georgia Office Building |
1,233 | 297 | 1,228 | — | 297 | 1,228 | 1,525 | 134 | 1,391 | 12/13/2007 | ||||||||||||||||||||||||||||||
| Reading, Pennsylvania Industrial Building |
5,216 | 491 | 6,202 | — | 491 | 6,202 | 6,693 | 626 | 6,067 | 1/29/2008 | ||||||||||||||||||||||||||||||
| Fridley, Minnesota (4) |
— | 1,354 | 8,074 | — | 1,383 | 8,074 | 9,457 | 1,112 | 8,345 | 2/26/2008 | ||||||||||||||||||||||||||||||
91
GLADSTONE COMMERCIAL CORPORATION
SCHEDULE III - REAL ESTATE AND ACCUMULATED DEPRECIATION
DECEMBER 31, 2011 (Dollars in Thousands)
| Initial Cost | Total Cost | |||||||||||||||||||||||||||||||||||||||
| Location of Property |
Encumbrances | Land | Buildings & Improvements |
Costs Capitalized Subsequent to Acquisition |
Land | Buildings & Improvements |
Total (1) | Accumulated Depreciation (2) |
Net Real Estate | Date Acquired |
||||||||||||||||||||||||||||||
| Concord Township, Ohio (4) Industrial Building |
— | 1,796 | 11,154 | — | 1,786 | 11,154 | 12,940 | 1,154 | 11,786 | 3/31/2008 | ||||||||||||||||||||||||||||||
| Pineville, North Carolina Industrial Building |
2,128 | 669 | 3,028 | 6 | 669 | 3,034 | 3,703 | 294 | 3,409 | 4/30/2008 | ||||||||||||||||||||||||||||||
| Marietta, Ohio Industrial Building |
4,464 | 829 | 6,607 | 209 | 829 | 6,816 | 7,645 | 575 | 7,070 | 8/29/2008 | ||||||||||||||||||||||||||||||
| Chalfont, Pennsylvania Industrial Building |
6,019 | 1,249 | 6,420 | — | 1,249 | 6,420 | 7,669 | 663 | 7,006 | 8/29/2008 | ||||||||||||||||||||||||||||||
| Orange City, Iowa Office and Warehouse Building |
10,402 | 132 | 9,383 | (3,522 | )(3) | 257 | 5,861 | 6,118 | 193 | 5,925 | 12/7/2010 | |||||||||||||||||||||||||||||
| Hickory, NC (4) |
— | 1,163 | 6,605 | — | 1,163 | 6,605 | 7,768 | 225 | 7,543 | 4/4/2011 | ||||||||||||||||||||||||||||||
| Springfield, MO |
11,505 | 1,700 | 12,038 | — | 1,700 | 12,038 | 13,738 | 191 | 13,547 | 6/20/2011 | ||||||||||||||||||||||||||||||
| Boston Heights, OH |
— | 449 | 3,010 | — | 449 | 3,010 | 3,459 | 26 | 3,433 | 10/20/2011 | ||||||||||||||||||||||||||||||
| Parsippany, NJ |
7,190 | 1,696 | 7,077 | — | 1,696 | 7,077 | 8,773 | 47 | 8,726 | 10/27/2011 | ||||||||||||||||||||||||||||||
| Dartmouth, MA |
4,352 | — | 4,236 | — | — | 4,236 | 4,236 | 14 | 4,222 | 11/18/2011 | ||||||||||||||||||||||||||||||
| Springfield, MO |
— | — | 2,275 | — | — | 2,275 | 2,275 | 4 | 2,271 | 12/13/2011 | ||||||||||||||||||||||||||||||
| Pittsburgh, PA |
— | 281 | 3,205 | — | 281 | 3,205 | 3,486 | 1 | 3,485 | 12/28/2011 | ||||||||||||||||||||||||||||||
|
|
|
|
|
|
|
|
|
|
|
|
|
|
|
|
|
|
|
|||||||||||||||||||||||
| $ | 286,193 | $ | 60,457 | $ | 377,907 | $ | 4,011 | $ | 60,602 | $ | 381,919 | $ | 442,521 | $ | 53,784 | $ | 388,737 | |||||||||||||||||||||||
|
|
|
|
|
|
|
|
|
|
|
|
|
|
|
|
|
|
|
|||||||||||||||||||||||
| (1) | The aggregate cost for land and building improvements for federal income tax purposes is the same as the total gross cost of land and building improvements. |
| (2) | Depreciable life of all buildings is 39 years. Depreciable life of all improvements is the shorter of the useful life of the assets or the life of the respective leases on each building, which range from 5-20 years. |
| (3) | Refer to Note 1, out of period adjustment. |
| (4) | These properties were pledged as borrowing base assets under the line of credit. |
92
The following table reconciles the change in the balance of real estate during the years ended December 31, 2011, 2010 and 2009, respectively (Dollars in Thousands):
| 2011 | 2010 | 2009 | ||||||||||
| Balance at beginning of period |
$ | 401,017 | $ | 390,754 | $ | 390,562 | ||||||
| Additions: |
||||||||||||
| Acquisitions during period |
43,735 | 8,901 | — | |||||||||
| Improvements or other additions |
1,164 | 1,362 | 1,140 | |||||||||
| Deductions: |
||||||||||||
| Dispositions during period |
— | — | (948 | ) | ||||||||
| Purchase price adjustments |
(3,395 | )(1) | — | — | ||||||||
|
|
|
|
|
|
|
|||||||
| Balance at end of period |
$ | 442,521 | $ | 401,017 | $ | 390,754 | ||||||
|
|
|
|
|
|
|
|||||||
| (1) | Adjustment to Orange City, Iowa property acquired in December 2010 property purchase price. Refer to Note 1 out of period adjustment. |
The following table reconciles the change in the balance of accumulated depreciation during the years ended December 31, 2011, 2010 and 2009, respectively (Dollars in Thousands):
| 2011 | 2010 | 2009 | ||||||||||
| Balance at beginning of period |
$ | 43,659 | $ | 34,112 | $ | 24,757 | ||||||
| Additions during period |
10,125 | 9,547 | 9,446 | |||||||||
| Dispositions during period |
— | — | (91 | ) | ||||||||
|
|
|
|
|
|
|
|||||||
| Balance at end of period |
$ | 53,784 | $ | 43,659 | $ | 34,112 | ||||||
|
|
|
|
|
|
|
|||||||
93
Item 9. Changes in and Disagreements With Accountants on Accounting and Financial Disclosure.
None.
Item 9A. Controls and Procedures.
a) Evaluation of Disclosure Controls and Procedures
As of December 31, 2011, our management, including our chief executive officer and chief financial officer, evaluated the effectiveness of the design and operation of our disclosure controls and procedures. Based on that evaluation, management, including the chief executive officer and chief financial officer, concluded that our disclosure controls and procedures were effective as of December 31, 2011 in providing a reasonable level of assurance that information we are required to disclose in reports that we file or submit under the Exchange Act is recorded, processed, summarized, and reported within the time periods specified in applicable SEC rules and forms, including providing a reasonable level of assurance that information required to be disclosed by us in such reports is accumulated and communicated to our management, including our chief executive officer and our chief financial officer, as appropriate to allow timely decisions regarding required disclosure. However, in evaluating the disclosure controls and procedures, management recognized that any controls and procedures, no matter how well designed and operated can provide only reasonable assurance of necessarily achieving the desired control objectives, and management was required to apply its judgment in evaluating the cost-benefit relationship of possible controls and procedures.
b) Management’s Annual Report on Internal Control Over Financial Reporting
Refer to Management’s Report on Internal Controls over Financial Reporting located in Item 8 of this Form 10-K.
c) Attestation Report of the Registered Public Accounting Firm
Refer to the Report of Independent Registered Public Accounting Firm located in Item 8 of this Form 10-K.
d) Changes in Internal Control over Financial Reporting
There were no changes in our internal control over financial reporting that occurred during the quarter ended December 31, 2011 that have materially affected, or are reasonably likely to materially affect, our internal control over financial reporting.
None.
94
PART III
We will file a definitive Proxy Statement for our 2012 Annual Meeting of Stockholders (the “2012 Proxy Statement”) with the Securities and Exchange Commission, pursuant to Regulation 14A, not later than 120 days after December 31, 2011. Accordingly, certain information required by Part III has been omitted under General Instruction G(3) to Form 10-K. Only those sections of the 2012 Proxy Statement that specifically address the items set forth herein are incorporated by reference.
Item 10. Directors, Executive Officers and Corporate Governance.
The information required by Item 10 is hereby incorporated by reference from our 2012 Proxy Statement under the captions “Election of Directors,” “Section 16(a) Beneficial Ownership Reporting Compliance” and “Code of Ethics.”
Item 11. Executive Compensation.
The information required by Item 11 is hereby incorporated by reference from our 2012 Proxy Statement under the captions “Executive Compensation” and “Director Compensation.”
Item 12. Security Ownership of Certain Beneficial Owners and Management and Related Stockholder Matters.
The information required by Item 12 is hereby incorporated by reference from our 2012 Proxy Statement under the caption “Security Ownership of Certain Beneficial Owners and Management.”
Item 13. Certain Relationships and Related Transactions, and Director Independence.
The information required by Item 13 is hereby incorporated by reference from our 2012 Proxy Statement under the captions “Transactions with Related Persons” and “Information Regarding the Board of Directors and Corporate Governance.”
Item 14. Principal Accountant Fees and Services.
The information required by Item 14 is hereby incorporated by reference from our 2012 Proxy Statement under the captions “Independent Registered Public Accounting Firm Fees” and “Pre-Approval Policy and Procedures.”
95
PART IV
Item 15. Exhibits and Financial Statement Schedules
a. DOCUMENTS FILED AS PART OF THIS REPORT
| 1. | The following financial statements are filed herewith: |
Report of Management on Internal Controls over Financial Reporting
Report of Independent Registered Public Accounting Firm
Consolidated Balance Sheets as of December 31, 2011 and December 31, 2010
Consolidated Statements of Operations for the years ended December 31, 2011, 2010 and 2009
Consolidated Statements of Stockholders’ Equity for the years ended December 31, 2011, 2010 and 2009
Consolidated Statements of Cash Flows for the years ended December 31, 2011, 2010 and 2009
Notes to Financial Statements
| 2. | Financial statement schedules |
Schedule III – Real Estate and Accumulated Depreciation is filed herewith.
Schedule IV – Mortgage Loans on Real Estate is filed herewith.
All other schedules are omitted because they are not applicable, or because the required information is included in the financial statements or notes thereto.
| 3. | Exhibits |
The following exhibits are filed as part of this report or hereby incorporated by reference to exhibits previously filed with the Securities and Exchange Commission:
96
Exhibit Index
| Exhibit |
Exhibit Description | |
| 3.1 |
Articles of Amendment and Restatement to Articles of Incorporation of the Registrant, incorporated by reference to Exhibit 3.1 to the Registrant’s Registration Statement on Form S-11 (File No. 333-106024), filed June 11, 2003. | |
| 3.1.1 |
Articles Supplementary of the Registrant Establishing and Fixing the Rights and Preferences of 7.75% Series A Cumulative Redeemable Preferred Stock, incorporated by reference to Exhibit 3.3 of the Registrant’s Form 8-A12G (File No. 000-50363), filed January 19, 2006. | |
| 3.1.2 |
Articles of Amendment to Articles Supplementary of the Registrant Establishing and Fixing the Rights and Preferences of 7.75% Series A Cumulative Redeemable Preferred Stock, incorporated by reference to Exhibit 99.1 of the Registrant’s Form 8-K, filed on April 13, 2006. | |
| 3.1.3 |
Articles Supplementary of the Registrant Establishing and Fixing the Rights and Preferences of the 7.5% Series B Cumulative Redeemable Preferred Stock, incorporated by reference to Exhibit 3.4 of the Registrant’s Form 8-A12B (File No. 000-50363), filed October 19, 2006. | |
| 3.1.4 |
Articles of Amendment to Articles of Amendment and Restatement to Articles of Incorporation of the Registrant, incorporated by reference to Exhibit 3.1.1 to the Registrant’s Quarterly Report on Form 10-Q, filed July 30, 2009. | |
| 3.1.5 |
Articles Supplementary of the Registrant, incorporated by reference to Exhibit 3.1 to the Registrant’s Current Report on Form 8-K, filed March 19, 2010. | |
| 3.1.6 |
Articles Supplementary of the Registrant, incorporated by reference to Exhibit 3.1 of the Registrant’s Current Report on Form 8-K, filed September 9, 2010. | |
| 3.1.7 |
Articles Supplementary of the Registrant, incorporated by reference to Exhibit 3.2 of the Registrant’s Current Report on Form 8-K, filed September 9, 2010. | |
| 3.1.8 |
Articles Supplementary Establishing and Fixing the Rights and Preferences of the 7.125% Series C Cumulative Term Preferred Stock, incorporated by reference to Exhibit 3.1 of Form 8-K (File No. 001-33097), filed January 25, 2012. | |
| 3.2 |
Bylaws of the Registrant, incorporated by reference to Exhibit 3.2 to the Registration Statement on Form S-11 (File No. 333-106024), filed June 11, 2003. | |
| 3.2.1 |
First Amendment to Bylaws of the Registrant, incorporated by reference to Exhibit 99.1 of the Registrant’s Current Report on Form 8-K, (File No. 001-33097) filed July 10, 2007. | |
| 4.1 |
Form of Certificate for Common Stock of the Registrant, incorporated by reference to Exhibit 4.1 to the Registrant’s Registration Statement on Form S-11 (File No. 333-106024), filed August 8, 2003. | |
| 4.2 |
Form of Certificate for 7.75% Series A Cumulative Redeemable Preferred Stock of the Registrant, incorporated by reference to Exhibit 4.1 of the Registrant’s Form 8-A12G (File No. 000-50363), filed January 19, 2006. | |
97
| 4.3 |
Form of Certificate for 7.50% Series B Cumulative Redeemable Preferred Stock of the Registrant, incorporated by reference to Exhibit 4.2 of the Registrant’s Form 8-A12B (File No. 001-33097), filed October 19, 2006. | |
| 4.4 |
Form of Certificate for 7.125% Series C Cumulative Term Preferred Stock of Gladstone Commercial Corporation, incorporated by reference to Exhibit 4.4 of the Current Report on Form 8-A12B (File No. 333-128783), filed January 31, 2012. | |
| 10.1 |
Promissory Note between Key Bank National Association and CMI04 Canton NC LLC, dated March 14, 2005, incorporated by reference to Exhibit 10.1 of the Quarterly Report on Form 10-Q for the quarter ended March 31, 2005 (File No. 000-50363), filed May 4, 2005. | |
| 10.2 |
Loan Agreement between AFL05 Duncan SC LLC and Little Arch Charlotte NC LLC and Bank of America, N.A., dated as of August 25, 2005, incorporated by reference to Exhibit 10.4 of the Current Report on Form 8-K (File No. 000-50363), filed August 29, 2005. | |
| 10.3 |
Promissory Note between AFL05 Duncan SC LLC and Little Arch Charlotte NC LLC and Bank of America, N.A., dated as of August 25, 2005, incorporated by reference to Exhibit 10.5 of the Current Report on Form 8-K (File No. 000-50363), filed August 29, 2005. | |
| 10.4 |
Mortgage and Security Agreement between 260 Springside Drive, Akron OH LLC and JP Morgan Chase Bank, N.A., dated as of September 12, 2005, incorporated by reference to Exhibit 10.6 of the Current Report on Form 8-K (File No. 000-50363), filed September 13, 2005. | |
| 10.5 |
Fixed Rate Note between 260 Springside Drive, Akron OH LLC and JP Morgan Chase Bank, N.A., dated as of September 12, 2005, incorporated by reference to Exhibit 10.7 of the Current Report on Form 8-K (File No. 000-50363), filed September 13, 2005. | |
| 10.6 |
Loan Agreement between PZ05 Maple Heights OH LLC, WMI05 Columbus OH LLC, and OB Crenshaw GCC, LP, and Countrywide Commercial Real Estate Finance, Inc., dated as of December 21, 2005, incorporated by reference to Exhibit 10.8 of the Current Report on Form 8-K (File No. 000-50363), filed December 22, 2005. | |
| 10.7 |
Promissory Note between PZ05 Maple Heights OH LLC, WMI05 Columbus OH LLC, and OB Crenshaw GCC, LP, and Countrywide Commercial Real Estate Finance, Inc., dated as of December 21, 2005, incorporated by reference to Exhibit 10.9 of the Current Report on Form 8-K (File No. 000-50363), filed December 22, 2005. | |
| 10.8 |
First Amended and Restated Agreement of Limited Partnership of Gladstone Commercial Limited Partnership, incorporated by reference to Exhibit 10.1 of the Current Report on Form 8-K, filed February 1, 2006. | |
| 10.9 |
Mortgage and Absolute Assignment of Rents and Leases and Security Agreement (and Fixture Filing) between Stonewater Dox Funding LLC and Wells Fargo Bank, National Association, dated as of November 21, 2003, incorporated by reference to Exhibit 10.20 of the Current Report on Form 8-K (File No. 000-50363), filed February 24, 2006. | |
| 10.10 |
Assumption Agreement between Stonewater Dox Funding LLC, Stonewater Funding, LLC, ACI06 Champaign IL LLC, Gladstone Commercial Corporation and LaSalle Bank National Association, dated as of February 21, 2006, incorporated by reference to Exhibit 10.21 of the Current Report on Form 8-K (File No. 000-50363), filed February 24, 2006. | |
| 10.11 |
Promissory Note Secured by Mortgage between Stonewater Dox Funding LLC and Wells Fargo Bank, National Association, dated as of November 21, 2003, incorporated by reference to Exhibit 10.22 of the Current Report on Form 8-K (File No. 000-50363), filed February 24, 2006. | |
98
| 10.12 |
Mortgage, Assignment of Rents and Security Agreement between Stonewater Funding LLC and Greenwich Capital Financial Products, Inc. dated as of May 12, 2004, incorporated by reference to Exhibit 10.24 of the Current Report on Form 8-K (File No. 000-50363), filed February 24, 2006. | |
| 10.13 |
Loan Assumption Agreement between Stonewater UIS Funding LLC, Stonewater Funding, LLC, and UC06 Roseville MN LLC, Gladstone Commercial Corporation and LaSalle Bank National Association, dated as of February 21, 2006, incorporated by reference to Exhibit 10.25 of the Current Report on Form 8-K (File No. 000-50363), filed February 24, 2006. | |
| 10.14 |
Promissory Note between Stonewater UIS Funding LLC and Greenwich Capital Financial Products, Inc. dated as of May 12, 2004, incorporated by reference to Exhibit 10.26 of the Current Report on Form 8-K (File No. 000-50363), filed February 24, 2006. | |
| 10.15 |
Loan Agreement between IXIS Real Estate Capital Inc. and 2525 N Woodlawn Vstrm Wichita KS, LLC, CI05 Clintonville WI LLC and MSI05-3 LLC, dated as of April 27, 2006, incorporated by reference to Exhibit 10.29 of the Quarterly Report on Form 10-Q (File No. 000-50363), filed May 2, 2006. | |
| 10.16 |
Promissory Note between IXIS Real Estate Capital Inc. and 2525 N Woodlawn Vstrm Wichita KS, LLC, CI05 Clintonville WI LLC and MSI05-3 LLC, dated as of April 27, 2006, incorporated by reference to Exhibit 10.30 of the Quarterly Report on Form 10-Q (File No. 000-50363), filed May 2, 2006. | |
| 10.17 |
Gladstone Commercial Limited Partnership Schedule 4.2(a)(2) to First Amended and Restated Agreement of Limited Partnership Designation of 7.50% Series B Cumulative Redeemable Preferred Units, incorporated by reference to Exhibit 10.1 of the Current Report on Form 8-K, filed October 25, 2006. | |
| 10.18 |
Deed of Trust, Assignment of Leases and Rents and Security Agreement between First Park Ten COCO San Antonio, L.P. and CIBC Inc., dated as of November 22, 2006, incorporated by reference to Exhibit 10.1 of the Current Report on Form 8-K (File No. 001-33097), filed November 28, 2006. | |
| 10.19 |
Deed of Trust, Assignment of Leases and Rents and Security Agreement between SLEE Grand Prairie, L.P. and CIBC Inc., dated as of November 22, 2006, incorporated by reference to Exhibit 10.2 of the Current Report on Form 8-K (File No. 001-33097), filed November 28, 2006. | |
| 10.20 |
Deed of Trust, Assignment of Leases and Rents and Security Agreement between OB Midway NC Gladstone Commercial LLC, and CIBC Inc., dated as of November 22, 2006, incorporated by reference to Exhibit 10.3 of the Current Report on Form 8-K (File No. 001-33097), filed November 28, 2006. | |
| 10.21 |
Promissory Note First Park Ten COCO San Antonio, L.P., SLEE Grand Prairie, L.P. and OB Midway NC Gladstone Commercial LLC and CIBC Inc., dated as of November 22, 2006, incorporated by reference to Exhibit 10.4 of the Current Report on Form 8-K (File No. 001-33097), filed November 28, 2006. | |
| 10.22 |
Mortgage, Assignment of Leases and Rents and Security Agreement between HMBF05 Newburyport MA LLC and CIBC Inc., dated as of December 22, 2006, incorporated by reference to Exhibit 10.1 of the Current Report on Form 8-K (File No. 001-33097), filed December 28, 2006. | |
99
| 10.23 |
Open-end Mortgage, Assignment of Leases and Rents and Security Agreement between SVMMC05 Toledo OH LLC and CIBC Inc., dated as of December 22, 2006, incorporated by reference to Exhibit 10.2 of the Current Report on Form 8-K (File No. 001-33097), filed December 28, 2006. | |
| 10.24 |
Mortgage, Assignment of Leases and Rents and Security Agreement between TCI06 Burnsville MN LLC and CIBC Inc., dated as of December 22, 2006, incorporated by reference to Exhibit 10.3 of the Current Report on Form 8-K (File No. 001-33097), filed December 28, 2006. | |
| 10.25 |
Promissory Note between HMBF05 Newburyport MA LLC, SVMMC05 Toledo OH LLC and TCI06 Burnsville MN LLC and CIBC Inc., dated as of December 22, 2006, incorporated by reference to Exhibit 10.4 of the Current Report on Form 8-K (File No. 001-33097), filed December 28, 2006. | |
| 10.26 |
Amended and Restated Investment Advisory Agreement between Gladstone Commercial Corporation and Gladstone Management Corporation, dated January 1, 2007 incorporated by reference to Exhibit 99.1 of the Current Report on Form 8-K (File No. 001-33097), filed January 3, 2007 (renewed on July 12, 2011). | |
| 10.27 |
Administration Agreement between Gladstone Commercial Corporation and Gladstone Administration, LLC, dated January 1, 2007 incorporated by reference to Exhibit 99.2 of the Current Report on Form 8-K (File No. 001-33097), filed January 3, 2007 (renewed on July 12, 2011). | |
| 10.28 |
Open Market Sale Agreement by and among Gladstone Commercial Corporation, Gladstone Commercial Limited Partnership and Jefferies & Company, Inc., incorporated by reference to Exhibit 1.1 of the Current Report on Form 8-K (File No. 001-33097), filed November 4, 2009. | |
| 10.29 |
Amendment to First Amended and Restated Agreement of Limited Partnership of Gladstone Commercial Limited Partnership, incorporated by reference to Exhibit 10.1 of the Current Report on Form 8-K, filed April 29, 2010. | |
| 10.30 |
Gladstone Commercial Limited Partnership Schedule 4.2(a)(3) to First Amended and Restated Agreement of Limited Partnership; Designation of Senior Common Units, incorporated by reference to Exhibit 10.2 of the Current Report on Form 8-K, filed April 29, 2010. | |
| 10.31 |
Amended and Restated Dealer Manager Agreement, dated December 22, 2009, by and between Gladstone Commercial Corporation and Halcyon Capital Markets, LLC, incorporated by reference to Exhibit 10.39 of the Annual Report on Form 10-K (File No. 001-33097), filed on February 24, 2010. | |
| 10.32 |
Amended and Restated Dealer Manager Agreement, effective as of December 22, 2009, by and between Gladstone Commercial Corporation and Halcyon Capital Markets, LLC, incorporated by reference to Exhibit 10.40 of the Annual Report on Form 10-K (File No. 001-33097), filed on February 24, 2010. | |
| 10.33 |
Credit Agreement, dated as of December 28, 2010, by and among Gladstone Commercial Limited Partnership, Gladstone Commercial Corporation, each of the financial institutions initially a signatory thereto together with their successors and assignees under Section 12.6 thereof and Capital One, N.A., incorporated by reference to Exhibit 10.1 of the Current Report on Form 8-K, filed December 30, 2010. | |
100
| 10.34 |
Form of Second Amendment to Credit Agreement and Omnibus Amendment of Loan Documents, incorporated by reference to Exhibit 10.1 of the Current Report on Form 8-K, filed January 31, 2012. | |
| 10.35 |
Second Amendment to First Amended and Restated Agreement of Limited Partnership of Gladstone Commercial Limited Partnership, incorporated by reference to Exhibit 10.1 to the Current Report on Form 8-K, filed February 3, 2012. | |
| 10.36 |
Gladstone Commercial Limited Partnership Schedule 4.2(a)(4) to First Amended and Restated Agreement of Limited Partnership Designation of 7.125% Series C Cumulative Term Preferred Units, incorporated by reference to Exhibit 10.2 to the Current Report on Form 8-K, filed February 3, 2012. | |
| 11 |
Computation of Per Share Earnings from Operations (included in the notes to the audited financial statements contained in this Report. | |
| 12 |
Statements re: computation of ratios (included in Selected Financial Data contained in this Form 10-K). | |
| 14 |
Gladstone Commercial Corporation Code of Business Conduct and Ethics, dated October 11, 2005, incorporated by reference to Exhibit 14.1 to Current Report on Form 8-K (File No. 000-50363), filed October 12, 2005. | |
| 21 |
List of Subsidiaries of Gladstone Commercial Corporation (filed herewith). | |
| 23 |
Consent of PricewaterhouseCoopers LLP (filed herewith). | |
| 31.1 |
Certification of Chief Executive Officer pursuant to Section 302 of The Sarbanes-Oxley Act of 2002 (filed herewith). | |
| 31.2 |
Certification of Chief Financial Officer pursuant to Section 302 of The Sarbanes-Oxley Act of 2002 (filed herewith). | |
| 32.1 |
Certification of Chief Executive Officer pursuant to Section 906 of The Sarbanes-Oxley Act of 2002 (furnished herewith). | |
| 32.2 |
Certification of Chief Financial Officer pursuant to Section 906 of The Sarbanes-Oxley Act of 2002 (furnished herewith). | |
| 101.INS*** |
XBRL Instance Document | |
| 101.SCH*** |
XBRL Taxonomy Extension Schema Document | |
| 101.CAL*** |
XBRL Taxonomy Extension Calculation Linkbase Document | |
| 101.LAB*** |
XBRL Taxonomy Extension Label Linkbase Document | |
| 101.PRE*** |
XBRL Taxonomy Extension Presentation Linkbase Document | |
| *** | The following financial information of the Registrant is included for the year ended December, 31, 2011, formatted in XBRL (eXtensible Business Reporting Language): (i) Consolidated Balance Sheets, (ii) Consolidated Statements of Operations, (iii) Consolidated Statements of Stockholders’ Equity, (iv) Consolidated Statements of Cash Flows and (v) Notes to Consolidated Financial Statements. |
101
Pursuant to Rule 406T of Regulation S-T, the Interactive Data Files on Exhibit 101 hereto are deemed not filed or part of a registration statement or prospectus for purposes of Sections 11 or 12 of the Securities Act of 1933, as amended, are deemed not filed for purposes of Section 18 of the Securities and Exchange Act of 1934, as amended, and otherwise are not subject to liability under those sections.
102
SIGNATURES
Pursuant to the requirements of Section 13 or 15(d) of the Securities Exchange Act of 1934, the registrant has duly caused this report to be signed on its behalf by the undersigned, thereunto duly authorized.
| Gladstone Commercial Corporation | ||||||||||
| Date: February 28, 2012 | By: | /s/ Danielle Jones |
||||||||
| Danielle Jones | ||||||||||
| Chief Financial Officer | ||||||||||
| Date: February 28, 2012 | By: | /s/ David Gladstone |
||||||||
| David Gladstone | ||||||||||
| Chief Executive Officer and Chairman of the Board of Directors |
||||||||||
Pursuant to the requirements of the Securities Exchange Act of 1934, this report has been signed below by the following persons on behalf of the registrant and in the capacity and on the dates indicated.
| Date: February 28, 2012 | By: | /s/ David Gladstone |
||||||
| David Gladstone Chief Executive Officer and Chairman of the Board of Directors (principal executive officer) |
||||||||
| Date: February 28, 2012 | By: | /s/ Terry Lee Brubaker |
||||||
| Terry Lee Brubaker Vice Chairman, Chief Operating Officer and Director |
||||||||
| Date: February 28, 2012 | By: | /s/ George Stelljes III |
||||||
| George Stelljes III President, Chief Investment Officer and Director |
||||||||
| Date: February 28, 2012 | By: | /s/ Danielle Jones |
||||||
| Danielle Jones Chief Financial Officer (principal financial and accounting officer) |
||||||||
| Date: February 28, 2012 | By: | /s/ David A.R. Dullum |
||||||
| David A.R. Dullum Director |
||||||||
103
| Date: February 28, 2012 | By: | /s/ Anthony W. Parker |
||||||
| Anthony W. Parker Director |
||||||||
| Date: February 28, 2012 | By: | /s/ Michela A. English |
||||||
| Michela A. English Director |
||||||||
| Date: February 28, 2012 | By: | /s/ Paul Adelgren |
||||||
| Paul Adelgren Director |
||||||||
| Date: February 28, 2012 | By: | /s/ John Outland |
||||||
| John Outland Director |
||||||||
| Date: February 28, 2012 | By: | /s/ Gerard Mead |
||||||
| Gerard Mead Director |
||||||||
| Date: February 28, 2012 | By: | /s/ John Reilly |
||||||
| John Reilly Director |
||||||||
104