UNITED STATES
SECURITIES AND EXCHANGE COMMISSION
WASHINGTON, D.C. 20549
FORM 10-Q
(Mark One)
| x | QUARTERLY REPORT PURSUANT TO SECTION 13 OR 15(d) OF THE SECURITIES EXCHANGE ACT OF 1934 |
FOR THE QUARTERLY PERIOD ENDED SEPTEMBER 30, 2013
OR
| ¨ | TRANSITION REPORT PURSUANT TO SECTION 13 OR 15(d) OF THE SECURITIES EXCHANGE ACT OF 1934 |
FOR THE TRANSITION PERIOD FROM TO
COMMISSION FILE NUMBER: 001-33097
GLADSTONE COMMERCIAL CORPORATION
(Exact name of registrant as specified in its charter)
| MARYLAND | 02-0681276 | |
| (State or other jurisdiction of incorporation or organization) |
(I.R.S. Employer Identification No.) | |
| 1521 WESTBRANCH DRIVE, SUITE 200 MCLEAN, VIRGINIA |
22102 | |
| (Address of principal executive offices) | (Zip Code) | |
(703) 287-5800
(Registrant’s telephone number, including area code)
Not Applicable
(Former name, former address and formal fiscal year, if changed since last report)
Indicate by check mark whether the registrant: (1) has filed all reports required to be filed by Section 13 or 15(d) of the Securities Exchange Act of 1934 during the preceding 12 months (or for such shorter period that the registrant was required to file such reports), and (2) has been subject to such filing requirements for the past 90 days. Yes x No ¨
Indicate by check mark whether the registrant has submitted electronically and posted on its corporate Web site, if any, every Interactive Data File required to be submitted and posted pursuant to Rule 405 of Regulation S-T during the preceding 12 months (or for such shorter period that the registrant was required to submit and post such files). Yes x No ¨
Indicate by check mark whether the registrant is a large accelerated filer, an accelerated filer, a non-accelerated filer, or a smaller reporting company. See the definitions of “large accelerated filer,” “accelerated filer” and “smaller reporting company” in Rule 12b-2 of the Exchange Act. (Check one):
| Large accelerated filer | ¨ | Accelerated filer | x | |||
| Non-accelerated filer | ¨ (Do not check if a smaller reporting company) | Smaller reporting company | ¨ | |||
Indicate by check mark whether the registrant is a shell company (as defined in Rule 12b-2 of the Exchange Act). Yes ¨ No x
The number of shares of the registrant’s Common Stock, $0.001 par value, outstanding as of November 1, 2013 was 14,258,492.
GLADSTONE COMMERCIAL CORPORATION
FORM 10-Q FOR THE QUARTER ENDED
SEPTEMBER 30, 2013
| PART I |
FINANCIAL INFORMATION |
PAGE | ||||
| Item 1. |
Financial Statements (Unaudited) |
|||||
| Condensed Consolidated Balance Sheets as of September 30, 2013 and December 31, 2012 |
3 | |||||
| 4 | ||||||
| 5 | ||||||
| 6 | ||||||
| Item 2. |
Management’s Discussion and Analysis of Financial Condition and Results of Operations |
24 | ||||
| Item 3. |
42 | |||||
| Item 4. |
43 | |||||
| PART II |
OTHER INFORMATION |
|||||
| Item 1. |
44 | |||||
| Item 1A. |
44 | |||||
| Item 2. |
44 | |||||
| Item 3. |
44 | |||||
| Item 4. |
45 | |||||
| Item 5. |
45 | |||||
| Item 6. |
45 | |||||
| 48 | ||||||
2
Gladstone Commercial Corporation
Condensed Consolidated Balance Sheets
(Dollars in Thousands, Except Share and Per Share Data)
(Unaudited)
| September 30, 2013 | December 31, 2012 | |||||||
| ASSETS |
||||||||
| Real estate, at cost |
$ | 622,481 | $ | 533,753 | ||||
| Less: accumulated depreciation |
76,923 | 65,730 | ||||||
|
|
|
|
|
|||||
| Total real estate, net |
545,558 | 468,023 | ||||||
| Lease intangibles, net |
75,345 | 57,254 | ||||||
| Cash and cash equivalents |
4,531 | 5,546 | ||||||
| Restricted cash |
6,406 | 2,935 | ||||||
| Funds held in escrow |
8,986 | 7,591 | ||||||
| Deferred rent receivable, net |
17,998 | 15,124 | ||||||
| Deferred financing costs, net |
6,643 | 6,569 | ||||||
| Other assets |
945 | 1,737 | ||||||
|
|
|
|
|
|||||
| TOTAL ASSETS |
$ | 666,412 | $ | 564,779 | ||||
|
|
|
|
|
|||||
| LIABILITIES AND STOCKHOLDERS’ EQUITY |
||||||||
| LIABILITIES |
||||||||
| Mortgage notes payable |
$ | 409,762 | $ | 359,185 | ||||
| Borrowings under line of credit |
28,900 | 25,000 | ||||||
| Series C mandatorily redeemable preferred stock, par value $0.001 per share; $25 per share liquidation preference; 1,700,000 shares authorized; and 1,540,000 shares issued and outstanding at September 30, 2013 and December 31, 2012, respectively |
38,500 | 38,500 | ||||||
| Deferred rent liability, net |
6,117 | 5,379 | ||||||
| Asset retirement obligation liability |
3,851 | 3,755 | ||||||
| Accounts payable and accrued expenses |
3,552 | 4,715 | ||||||
| Due to Adviser and Administrator (1) |
999 | 1,175 | ||||||
| Other liabilities |
9,874 | 4,705 | ||||||
|
|
|
|
|
|||||
| Total Liabilities |
$ | 501,555 | $ | 442,414 | ||||
|
|
|
|
|
|||||
| Commitments and contingencies (2) |
||||||||
| STOCKHOLDERS’ EQUITY |
||||||||
| Series A and B redeemable preferred stock, par value $0.001 per share; $25 per share liquidation preference; 2,300,000 shares authorized and 2,150,000 shares issued and outstanding at September 30, 2013 and December 31, 2012, respectively |
$ | 2 | $ | 2 | ||||
| Senior common stock, par value $0.001 per share; 7,500,000 shares authorized and 338,571 and 179,511 shares issued and outstanding at September 30, 2013 and December 31, 2012, respectively |
— | — | ||||||
| Common stock, par value $0.001 per share, 38,500,000 shares authorized and 14,258,492 and 11,083,584 shares issued and outstanding at September 30, 2013 and December 31, 2012, respectively |
14 | 11 | ||||||
| Additional paid in capital |
274,159 | 215,470 | ||||||
| Notes receivable - employee |
(375 | ) | (410 | ) | ||||
| Distributions in excess of accumulated earnings |
(108,943 | ) | (92,708 | ) | ||||
|
|
|
|
|
|||||
| Total Stockholders’ Equity |
164,857 | 122,365 | ||||||
|
|
|
|
|
|||||
| TOTAL LIABILITIES AND STOCKHOLDERS’ EQUITY |
$ | 666,412 | $ | 564,779 | ||||
|
|
|
|
|
|||||
| (1) | Refer to Note 2 “Related-Party Transactions” |
| (2) | Refer to Note 7 “Commitments and Contigencies” |
The accompanying notes are an integral part of these condensed consolidated financial statements.
3
Gladstone Commercial Corporation
Condensed Consolidated Statements of Operations
(Dollars in Thousands, Except Per Share Data)
(Unaudited)
| For the three months ended September 30, | For the nine months ended September 30, | |||||||||||||||
| 2013 | 2012 | 2013 | 2012 | |||||||||||||
| Operating revenues |
||||||||||||||||
| Rental income |
$ | 15,807 | $ | 12,878 | $ | 43,663 | $ | 37,214 | ||||||||
| Tenant recovery revenue |
383 | 92 | 819 | 264 | ||||||||||||
|
|
|
|
|
|
|
|
|
|||||||||
| Total operating revenues |
16,190 | 12,970 | 44,482 | 37,478 | ||||||||||||
|
|
|
|
|
|
|
|
|
|||||||||
| Operating expenses |
||||||||||||||||
| Depreciation and amortization |
6,253 | 4,276 | 16,374 | 12,172 | ||||||||||||
| Property operating expenses |
864 | 345 | 2,164 | 1,031 | ||||||||||||
| Acquisitions related expense |
163 | 117 | 622 | 805 | ||||||||||||
| Base management fee (1) |
559 | 355 | 1,363 | 1,120 | ||||||||||||
| Incentive fee (1) |
1,138 | 927 | 3,001 | 2,614 | ||||||||||||
| Administration fee (1) |
274 | 272 | 1,004 | 846 | ||||||||||||
| General and administrative |
377 | 343 | 1,243 | 1,130 | ||||||||||||
|
|
|
|
|
|
|
|
|
|||||||||
| Total operating expenses before credit to incentive fee |
9,628 | 6,635 | 25,771 | 19,718 | ||||||||||||
|
|
|
|
|
|
|
|
|
|||||||||
| Credit to incentive fee (1) |
(989 | ) | (535 | ) | (2,491 | ) | (1,794 | ) | ||||||||
|
|
|
|
|
|
|
|
|
|||||||||
| Total operating expenses |
8,639 | 6,100 | 23,280 | 17,924 | ||||||||||||
|
|
|
|
|
|
|
|
|
|||||||||
| Other income (expense) |
||||||||||||||||
| Interest expense |
(6,573 | ) | (5,229 | ) | (17,998 | ) | (14,687 | ) | ||||||||
| Distributions attributable to Series C mandatorily redeemable preferred stock |
(686 | ) | (686 | ) | (2,057 | ) | (1,829 | ) | ||||||||
| Other income |
17 | 37 | 47 | 109 | ||||||||||||
|
|
|
|
|
|
|
|
|
|||||||||
| Total other expense |
(7,242 | ) | (5,878 | ) | (20,008 | ) | (16,407 | ) | ||||||||
|
|
|
|
|
|
|
|
|
|||||||||
| Net income |
309 | 992 | 1,194 | 3,147 | ||||||||||||
|
|
|
|
|
|
|
|
|
|||||||||
| Distributions attributable to Series A and B preferred stock |
(1,023 | ) | (1,023 | ) | (3,070 | ) | (3,070 | ) | ||||||||
| Distributions attributable to senior common stock |
(83 | ) | (30 | ) | (204 | ) | (71 | ) | ||||||||
|
|
|
|
|
|
|
|
|
|||||||||
| Net (loss) income available to common stockholders |
$ | (797 | ) | $ | (61 | ) | $ | (2,080 | ) | $ | 6 | |||||
|
|
|
|
|
|
|
|
|
|||||||||
| Earnings per weighted average share of common stock - basic & diluted |
||||||||||||||||
| (Loss) income from continuing operations (net of dividends attributable to preferred stock) |
$ | (0.06 | ) | $ | (0.01 | ) | $ | (0.16 | ) | $ | 0.00 | |||||
|
|
|
|
|
|
|
|
|
|||||||||
| Net (loss) income available to common stockholders |
$ | (0.06 | ) | $ | (0.01 | ) | $ | (0.16 | ) | $ | 0.00 | |||||
|
|
|
|
|
|
|
|
|
|||||||||
| Dividends declared per share of common stock |
$ | 0.375 | $ | 0.375 | $ | 1.125 | $ | 1.125 | ||||||||
|
|
|
|
|
|
|
|
|
|||||||||
| Weighted average shares of common stock outstanding |
||||||||||||||||
| Basic |
14,196,423 | 10,945,379 | 12,613,354 | 10,945,379 | ||||||||||||
|
|
|
|
|
|
|
|
|
|||||||||
| Diluted |
14,196,423 | 10,945,379 | 12,613,354 | 11,022,682 | ||||||||||||
|
|
|
|
|
|
|
|
|
|||||||||
| Earnings per weighted average share of senior common stock |
$ | 0.26 | $ | 0.26 | $ | 0.78 | $ | 0.80 | ||||||||
|
|
|
|
|
|
|
|
|
|||||||||
| Weighted average shares of senior common stock outstanding - basic |
313,239 | 112,873 | 260,693 | 89,720 | ||||||||||||
|
|
|
|
|
|
|
|
|
|||||||||
| (1) | Refer to Note 2 “Related-Party Transactions” |
The accompanying notes are an integral part of these condensed consolidated financial statements.
4
Gladstone Commercial Corporation
Condensed Consolidated Statements of Cash Flows
(Dollars in Thousands)
(Unaudited)
| For the nine months ended September 30, | ||||||||
| 2013 | 2012 | |||||||
| Cash flows from operating activities: |
||||||||
| Net income |
$ | 1,194 | $ | 3,147 | ||||
| Adjustments to reconcile net income to net cash provided by operating activities: |
||||||||
| Depreciation and amortization |
16,374 | 12,172 | ||||||
| Amortization of deferred financing costs |
1,410 | 1,103 | ||||||
| Amortization of deferred rent asset and liability, net |
(243 | ) | (533 | ) | ||||
| Amortization of discount and premium on assumed debt |
(128 | ) | 45 | |||||
| Asset retirement obligation expense |
96 | 124 | ||||||
| Increase (decrease) in other assets |
242 | (261 | ) | |||||
| Increase in deferred rent liability |
— | 2,510 | ||||||
| Increase in deferred rent receivable |
(2,724 | ) | (1,189 | ) | ||||
| (Decrease) increase in accounts payable, accrued expenses, and amount due Adviser and Administrator |
(1,339 | ) | 2,810 | |||||
| Decrease in other liabilities |
1,698 | 240 | ||||||
| Leasing commissions paid |
(1,008 | ) | (1,538 | ) | ||||
|
|
|
|
|
|||||
| Net cash provided by operating activities |
15,572 | 18,630 | ||||||
|
|
|
|
|
|||||
| Cash flows from investing activities: |
||||||||
| Acquisition of real estate and related intangible assets |
(104,806 | ) | (47,307 | ) | ||||
| Improvements of existing real estate |
(5,355 | ) | (5,526 | ) | ||||
| Receipts from lenders for funds held in escrow |
5,764 | 1,286 | ||||||
| Payments to lenders for funds held in escrow |
(7,159 | ) | (3,406 | ) | ||||
| Receipts from tenants for reserves |
5,657 | 2,156 | ||||||
| Payments to tenants from reserves |
(2,167 | ) | (1,647 | ) | ||||
| Increase in restricted cash |
(3,472 | ) | (642 | ) | ||||
| Deposits on future acquisitions |
(2,125 | ) | (1,625 | ) | ||||
| Deposits applied against real estate investments |
2,675 | 1,125 | ||||||
|
|
|
|
|
|||||
| Net cash used in investing activities |
(110,988 | ) | (55,586 | ) | ||||
|
|
|
|
|
|||||
| Cash flows from financing activities: |
||||||||
| Proceeds from issuance of equity |
62,139 | 1,103 | ||||||
| Offering costs |
(3,533 | ) | (125 | ) | ||||
| Proceeds from issuance of mandatorily redeemable preferred stock |
— | 38,500 | ||||||
| Borrowings under mortgage notes payable |
56,108 | 46,455 | ||||||
| Payments for deferred financing costs |
(1,484 | ) | (3,483 | ) | ||||
| Principal repayments on mortgage notes payable |
(5,403 | ) | (5,544 | ) | ||||
| Principal repayments on employee notes receivable |
35 | 12 | ||||||
| Borrowings from line of credit |
58,900 | 19,300 | ||||||
| Repayments on line of credit |
(55,000 | ) | (32,500 | ) | ||||
| (Decrease) increase in security deposits |
(18 | ) | 134 | |||||
| Distributions paid for common, senior common and preferred stock |
(17,343 | ) | (15,443 | ) | ||||
|
|
|
|
|
|||||
| Net cash provided by financing activities |
94,401 | 48,409 | ||||||
|
|
|
|
|
|||||
| Net (decrease) increase in cash and cash equivalents |
(1,015 | ) | 11,453 | |||||
| Cash and cash equivalents, beginning of period |
5,546 | 3,329 | ||||||
|
|
|
|
|
|||||
| Cash and cash equivalents, end of period |
$ | 4,531 | $ | 14,782 | ||||
|
|
|
|
|
|||||
| Fixed rate debt assumed in connection with acquisitions |
$ | — | $ | 10,758 | ||||
|
|
|
|
|
|||||
| Senior common dividend issued in the dividend reinvestment program |
$ | 85 | $ | 11 | ||||
|
|
|
|
|
|||||
The accompanying notes are an integral part of these condensed consolidated financial statements.
5
Gladstone Commercial Corporation
Notes to Condensed Consolidated Financial Statements (Unaudited)
1. Organization, Basis of Presentation and Significant Accounting Policies
Gladstone Commercial Corporation, is a real estate investment trust, or REIT, that was incorporated under the General Corporation Laws of the State of Maryland on February 14, 2003 primarily for the purpose of investing in and owning net leased industrial, commercial and retail real property and selectively making long-term industrial and commercial mortgage loans. Subject to certain restrictions and limitations, our business is managed by Gladstone Management Corporation, a Delaware corporation, or the Adviser. We are externally managed pursuant to contractual arrangements with our Adviser and Gladstone Administration, LLC, or the Administrator, which collectively employ all of our personnel and pay their salaries, benefits, and general expenses directly.
Subsidiaries
We conduct substantially all of our operations through a subsidiary, Gladstone Commercial Limited Partnership, a Delaware limited partnership, or the Operating Partnership. As we currently own all of the general and limited partnership interests of the Operating Partnership through two of our subsidiaries, GCLP Business Trust I and II, the financial position and results of operations of the Operating Partnership are consolidated with those of the Company.
Gladstone Commercial Lending, LLC, a Delaware limited liability company, or Gladstone Commercial Lending, a subsidiary of ours, was created to conduct all operations related to real estate mortgage loans of the Company. As the Operating Partnership currently owns all of the membership interests of Gladstone Commercial Lending, the financial position and results of operations of Gladstone Commercial Lending are consolidated with those of the Company.
Gladstone Commercial Advisers, Inc., a Delaware corporation, or Commercial Advisers, and a subsidiary of the Company, is a taxable REIT subsidiary, or TRS, which was created to collect any non-qualifying income related to our real estate portfolio. There has been no such income earned to date. Since the Company owns 100% of the voting securities of Commercial Advisers, the financial position and results of operations of Commercial Advisers are consolidated with those of the Company.
GCLP Business Trust I and GCLP Business Trust II, each a subsidiary and business trust of the Company, were formed under the laws of the Commonwealth of Massachusetts on December 28, 2005. We transferred our 99% limited partnership interest in the Operating Partnership to GCLP Business Trust I in exchange for 100 shares of the trust. Gladstone Commercial Partners, LLC transferred its 1% general partnership interest in the Operating Partnership to GCLP Business Trust II in exchange for 100 trust shares.
All further references herein to “we,” “our,” “us” and the “Company” mean Gladstone Commercial Corporation and its consolidated subsidiaries, except where it is made clear that the term means only Gladstone Commercial Corporation.
Interim Financial Information
Our interim financial statements are prepared in accordance with accounting principles generally accepted in the United States of America, or GAAP, for interim financial information and pursuant to the requirements for reporting on Form 10-Q and in accordance with Article 10 of Regulation S-X. Accordingly, certain disclosures accompanying annual financial statements prepared in accordance with GAAP are omitted. The year-end balance sheet data was derived from audited financial statements, but does not include all disclosures required by GAAP. In the opinion of our management, all adjustments, consisting solely of normal recurring accruals, necessary for the fair statement of financial statements for the interim period have been included. The interim financial statements and notes thereto should be read in conjunction with the financial statements and notes thereto included in our Form 10-K for the year ended December 31, 2012, as filed with the Securities and Exchange Commission on February 19, 2013. The results of operations for the three and nine months ended September 30, 2013 are not necessarily indicative of the results that may be expected for other interim periods or for the full fiscal year.
6
Use of Estimates
The preparation of financial statements in conformity with GAAP requires management to make estimates and assumptions that affect the reported amounts of assets and liabilities and disclosure of contingent assets and liabilities at the date of the financial statements and the reported amounts of revenues and expenses during the reporting periods. Actual results could materially differ from those estimates.
Reclassifications
Certain line items on the condensed consolidated statements of operations and condensed consolidated statements of cash flows from prior year’s financial statements have been reclassified to conform to the current year presentation. These reclassifications had no effect on previously reported net income.
Real Estate and Lease Intangibles
We record investments in real estate at cost and capitalize improvements and replacements when they extend the useful life or improve the efficiency of the asset. We expense costs of repairs and maintenance as such costs are incurred. We compute depreciation using the straight-line method over the estimated useful life or 39 years for buildings and improvements, 5 to 7 years for equipment and fixtures, and the shorter of the useful life or the remaining lease term for tenant improvements and leasehold interests.
Certain of our acquisitions involve sale-leaseback transactions with newly-originated leases, which we account for as asset acquisitions under Accounting Standards Codification, or ASC, 805, “Business Combinations.” In the case of an asset acquisition, we will capitalize the transaction costs incurred in connection with the acquisition. Other of our acquisitions involve the acquisition of properties that are already being operated as rental property, which we will generally consider to be a business combination under ASC 805. Business combination guidance is generally applicable to us when properties are acquired with leases in place at the time of acquisition. When an acquisition is considered a business combination, ASC 805 requires that the purchase price of real estate be allocated to the acquired tangible assets and liabilities, consisting of land, building, tenant improvements, long-term debt and identified intangible assets and liabilities, typically the value of above-market and below-market leases, the value of in-place leases, the value of unamortized lease origination costs and the value of tenant relationships, based in each case on their fair values. ASC 805 also requires that all expenses related to the acquisition be expensed as incurred, rather than capitalized into the cost of the acquisition.
Management’s estimates of fair value are made using methods similar to those used by independent appraisers (e.g. discounted cash flow analysis). Factors considered by management in its analysis include an estimate of carrying costs during hypothetical expected lease-up periods considering current market conditions and costs to execute similar leases. We also consider information obtained about each property as a result of our pre-acquisition due diligence, marketing and leasing activities in estimating the fair value of the tangible and intangible assets and liabilities acquired. In estimating carrying costs, management also includes real estate taxes, insurance and other operating expenses and estimates of lost rentals at market rates during the hypothetical expected lease-up periods, which primarily range from 9 to 18 months, depending on specific local market conditions. Management also estimates costs to execute similar leases, including leasing commissions, legal and other related expenses to the extent that such costs are not already incurred in connection with a new lease origination as part of the transaction.
We allocate purchase price to the fair value of the tangible assets of an acquired property by valuing the property as if it were vacant. The “as-if-vacant” value is allocated to land, building and tenant improvements based on management’s determination of the relative fair values of these assets. Real estate depreciation expense on these tangible assets was $4.2 million and $11.2 million for the three and nine months ended September 30, 2013, respectively, and $3.0 million and $8.7 million for the three and nine months ended September 30, 2012, respectively.
7
Above-market and below-market in-place lease fair values for owned properties are recorded based on the present value (using an interest rate which reflects the risks associated with the leases acquired) of the difference between (i) the contractual amounts to be paid pursuant to the in-place leases and (ii) management’s estimate of fair market lease rates for the corresponding in-place leases, measured over a period equal to the remaining non-cancelable term of the lease. When determining the non-cancelable term of the lease, we evaluate if fixed-rate renewal options, if any, should be included. The capitalized above-market lease values, included in the accompanying condensed consolidated balance sheets as part of deferred rent receivable, are amortized as a reduction of rental income over the remaining non-cancelable terms of the respective leases. Total amortization related to above-market lease values was $0.1 million and $0.2 million for the three and nine months ended September 30, 2013, respectively, and $0.1 million and $0.3 million for the three and nine months ended September 30, 2012, respectively. The capitalized below-market lease values, included in the accompanying condensed consolidated balance sheets as part of deferred rent liability, are amortized as an increase to rental income over the remaining non-cancelable terms of the respective leases. Total amortization related to below-market lease values was $0.2 million and $0.4 million for the three and nine months ended September 30, 2013, respectively, and $0.3 million and $0.8 million for the three and nine months ended September 30, 2012, respectively.
The total amount of the remaining intangible assets acquired, which consists of in-place lease values, unamortized lease origination costs, and customer relationship intangible values, are allocated based on management’s evaluation of the specific characteristics of each tenant’s lease and our overall relationship with that respective tenant. Characteristics to be considered by management in determining these values include the nature and extent of our existing business relationships with the tenant, growth prospects for developing new business with the tenant, the tenant’s credit quality and our expectations of lease renewals (including those existing under the terms of the lease agreement), among other factors.
The value of in-place leases and lease origination costs are amortized to expense over the remaining term of the respective leases, which generally range from 10 to 15 years. The value of customer relationship intangibles, which is the benefit to us resulting from the likelihood of an existing tenant renewing its lease, are amortized to expense over the remaining term and any anticipated renewal periods in the respective leases, but in no event does the amortization period for intangible assets exceed the remaining depreciable life of the building. Should a tenant terminate its lease, the unamortized portion of the above-market and below-market lease values, in-place lease values, lease origination costs and customer relationship intangibles will be immediately charged to the related income or expense. Total amortization expense related to these intangible assets was $2.0 million and $5.2 million for the three and nine months ended September 30, 2013, respectively, and $1.2 million and $3.5 million for the three and nine months ended September 30, 2012, respectively.
Impairment
We account for the impairment of real estate, including intangible assets, in accordance with ASC 360-10-35, “Property, Plant, and Equipment,” which requires us to periodically review the carrying value of each property to determine if circumstances indicate impairment of the carrying value of the investment exists or that depreciation periods should be modified. If circumstances indicate the possibility of impairment, we prepare a projection of the undiscounted future cash flows, without interest charges, of the specific property and determine if the carrying value of the investment in such property is recoverable. In performing the analysis, we consider such factors as the tenants’ payment history and financial condition, the likelihood of lease renewal, business conditions in the industry in which the tenants operate and whether there are indications that the fair value of the real estate has decreased. If the carrying amount is more than the aggregate undiscounted future cash flows, we would recognize an impairment loss to the extent the carrying amount exceeds the estimated fair value of the property.
8
We evaluate our entire portfolio of properties each quarter for any impairment indicators and perform an impairment analysis on those select properties that have an indication of impairment. We performed this evaluation and analysis and concluded that none of our properties were impaired as of September 30, 2013; however, we determined that our property located in South Hadley, Massachusetts may become impaired in the future. We recently extended the lease on this property for one year, and it now expires in January 2015. There may be a possibility we would have to impair the property in 2014 if we do not negotiate another lease extension on this building or find a replacement tenant
We will continue to monitor our portfolio for any other indicators of impairment. There have been no impairments recognized on our real estate assets since inception.
Deferred Financing Costs
Deferred financing costs consist of costs incurred to obtain financing, including legal fees, origination fees and administrative fees. The costs are deferred and amortized using the straight-line method, which approximates the effective interest method, over the term of the secured financing. We made payments of $1.3 million and $1.5 million for deferred financing costs during the three and nine months ended September 30, 2013, respectively, and payments of $0.5 million and $3.5 million during the three and nine months ended September 30, 2012, respectively. The decrease in payments incurred during the nine months ended September 30, 2013 was primarily related to the issuance of our 7.125% Series C Cumulative Term Preferred Stock in January 2012, or the Term Preferred Stock, discussed in further detail in Note 6 “Mandatorily Redeemable Preferred Stock.” Total amortization expense related to deferred financing costs is included in interest expense and was $0.6 million and $1.4 million for the three and nine months ended September 30, 2013, respectively, and $0.4 million and $1.1 million for the three and nine months ended September 30, 2012, respectively.
Revenue Recognition
Rental revenue includes rents that each tenant pays in accordance with the terms of its respective lease reported evenly over the non-cancelable term of the lease. Most of our leases contain rental increases at specified intervals. We recognize such revenues on a straight-line basis. Deferred rent receivable in the accompanying condensed consolidated balance sheet includes the cumulative difference between rental revenue, as recorded on a straight-line basis, and rents received from the tenants in accordance with the lease terms, along with the capitalized above-market in-place lease values of certain acquired properties. Accordingly, we determine, in our judgment, to what extent the deferred rent receivable applicable to each specific tenant is collectable. We review deferred rent receivable, as it relates to straight line rents, on a quarterly basis and take into consideration the tenant’s payment history, the financial condition of the tenant, business conditions in the industry in which the tenant operates and economic conditions in the geographic area in which the property is located. In the event that the collectability of deferred rent with respect to any given tenant is in doubt, we record an allowance for uncollectable accounts or record a direct write-off of the specific rent receivable. No such reserves or direct write-offs have been recorded to date.
Tenant recovery revenue includes payments from tenants as reimbursements for franchise taxes, management fees, insurance, and ground lease payments. We recognize tenant recovery revenue in the same periods that we incur the related expenses.
Asset Retirement Obligations
ASC 410, “Asset Retirement and Environmental Obligation,” requires an entity to recognize a liability for a conditional asset retirement obligation when incurred if the liability can be reasonably estimated. ASC 410-20-20 clarifies that the term “Conditional Asset Retirement Obligation” refers to a legal obligation (pursuant to existing laws or by contract) to perform an asset retirement activity in which the timing and/or method of settlement are conditional on a future event that may or may not be within the control of the entity. ASC 410-20-25-6 clarifies when an entity would have sufficient information to reasonably estimate the fair value of an asset retirement obligation. We have accrued a liability and corresponding increase to the cost of the related properties for disposal related to all properties constructed prior to 1985 that have, or
9
may have, asbestos present in the building. The liabilities are accreted over the life of the leases for the respective properties. There were no liabilities accrued during the nine months ended September 30, 2013. There were $0.3 million in liabilities accrued in connection with acquisitions for the nine months ended September 30, 2012. We recorded expenses of $0.03 million and $0.1 million during the three and nine months ended September 30, 2013, respectively, and recorded expenses of $0.04 million and $0.12 million during the three and nine months ended September 30 2012, respectively. Costs of future expenditures for obligations are discounted to their present value. The aggregate undiscounted obligation on all properties is $9.2 million and the discount rates used in the calculations range from 2.5% to 7.6%. We do not expect to make any payments in conjunction with these obligations in each of the next five years.
Comprehensive Income
For the three and nine months ended September 30, 2013 and 2012, comprehensive income equaled net income; therefore, a separate statement of comprehensive income is not included in the accompanying condensed consolidated financial statements.
2. Related-Party Transactions
Gladstone Management and Gladstone Administration
We are externally managed pursuant to contractual arrangements with our Adviser and our Administrator which collectively employ all of our personnel and pay their salaries, benefits, and general expenses directly. We have an advisory agreement with our Adviser, or the Advisory Agreement, and an administration agreement with our Administrator, or the Administration Agreement. The management and administrative services and fees under the Advisory and Administration Agreements are described below. As of September 30, 2013 and December 31, 2012, $1.0 million and $1.2 million, respectively, was collectively due to our Adviser and Administrator.
Advisory Agreement
The Advisory Agreement provides for an annual base management fee equal to 2% of our total stockholders’ equity, less the recorded value of any preferred stock, or common stockholders’ equity, and an incentive fee based on funds from operations, or FFO. For the three and nine months ended September 30, 2013, we recorded a base management fee of $0.6 million and $1.4 million, respectively, and for the three and nine months ended September 30, 2012, we recorded a base management fee of $0.4 million and $1.1 million, respectively.
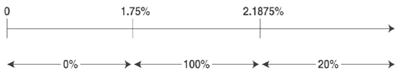
For purposes of calculating the incentive fee, FFO includes any realized capital gains and capital losses, less any distributions paid on preferred stock and senior common stock, but FFO does not include any unrealized capital gains or losses. The incentive fee rewards the Adviser if our quarterly FFO, before giving effect to any incentive fee, or pre-incentive fee FFO, exceeds 1.75%, or 7% annualized, or the hurdle rate, of total common stockholders’ equity. The Adviser receives 100% of the amount of the pre-incentive fee FFO that exceeds the hurdle rate, but is less than 2.1875% of our common stockholders’ equity. The Adviser also receives an incentive fee of 20% of the amount of our pre-incentive fee FFO that exceeds 2.1875% of common stockholders’ equity.
For the three and nine months ended September 30, 2013, we recorded an incentive fee of $1.1 million and $3.0 million, respectively, offset by credits related to unconditional, voluntary and irrevocable waivers issued by the Adviser of $1.0 million and $2.5 million, respectively, resulting in a net incentive fee for the three and nine months ended September 30, 2013, of $0.1 million and $0.5 million, respectively. For the three and nine months ended September 30, 2012, we recorded an incentive fee of $0.9 million and $2.6 million, respectively, offset by credits related to unconditional, voluntary and irrevocable waivers issued by the Adviser of $0.5 million and $1.8 million, respectively, resulting in a net incentive fee for the three and nine months ended September 30, 2012, of $0.4 million and $0.8 million, respectively. Our Board of Directors accepted the Adviser’s offer to waive, on a quarterly basis, a portion of the incentive fee for the three and nine months ended September 30, 2013 and 2012, in order to support the current level of distributions to our stockholders. This waiver may not be recouped by the Adviser in the future.
10
Administration Agreement
Pursuant to the Administration Agreement, we pay for our allocable portion of the Administrator’s overhead expenses in performing its obligations to us, including, but not limited to, rent and the salaries and benefits of its personnel, including our chief financial officer and treasurer, chief compliance officer, internal counsel and secretary and their respective staffs. Our allocable portion of expenses is derived by multiplying the Administrator’s total allocable expenses by the percentage of our total assets at the beginning of each quarter in comparison to the total assets of all companies managed by the Adviser under similar agreements. For the three and nine months ended September 30, 2013, we recorded an administration fee of $0.3 million and $1.0 million, respectively, and for the three and nine months ended September 30, 2012, we recorded an administration fee of $0.3 million and $0.8 million, respectively.
Gladstone Securities
Gladstone Securities, LLC, or Gladstone Securities, is an affiliate of ours, as its parent company is controlled by Mr. David Gladstone, our chairman and chief executive officer.
Dealer Manager Agreement
In connection with the offering of our senior common stock (see Note 8, “Stockholders’ Equity,” for further details) we entered into a Dealer Manager Agreement, dated March 25, 2011, or the Dealer Manager Agreement, with Gladstone Securities pursuant to which Gladstone Securities agreed to act as our exclusive dealer manager in connection with the offering. Pursuant to the terms of the Dealer Manager Agreement, Gladstone Securities is entitled to receive a sales commission in the amount of 7.0% of the gross proceeds of the shares of senior common stock sold, plus a dealer manager fee in the amount of 3.0% of the gross proceeds of the shares of senior common stock sold. Gladstone Securities, in its sole and absolute discretion, may re-allocate all of its selling commissions attributable to a participating broker-dealer and may also re-allocate a portion of its dealer manager fee earned in respect of the proceeds generated by the participating broker-dealer to any participating broker-dealer as a non-accountable marketing allowance. In addition, we have agreed to indemnify Gladstone Securities against various liabilities, including certain liabilities arising under the federal securities laws. We made approximately $0.05 million and $0.2 million of payments during the three and nine months ended September 30, 2013, respectively, and we made approximately $0.06 million and $0.1 million of payments during the three and nine months ended September 30, 2012, respectively, to Gladstone Securities pursuant to this agreement, which currently is scheduled to terminate on the earlier of (i) March 28, 2015 or (ii) the date on which 3,000,000 shares of Senior Common Stock are sold pursuant to the Dealer Manager Agreement.
Mortgage Financing Arrangement Agreement
We also entered into an agreement with Gladstone Securities, effective June 18, 2013, for it to act as our non-exclusive agent to assist us with arranging mortgage financing for properties we own. In connection with this engagement, Gladstone Securities may from time to time solicit the interest of various commercial real estate lenders or recommend to us third party lenders offering credit products or packages that are responsive to our needs. We will pay Gladstone Securities a financing fee in connection with the services it provides to us for securing mortgage financing on any of our properties. The amount of these financing fees which are payable upon closing of the financing, will be based on a percentage of the amount of the mortgage, generally ranging from 0.5% to a maximum of 1.0% of the mortgage obtained. The amount of the financing fees may be reduced or eliminated, as determined by us and Gladstone Securities, after taking into consideration various factors, including, but not limited to, the involvement of any third party brokers and market conditions. We paid financing fees to Gladstone Securities of $0.04 million during both the three and nine months ended September 30, 2013 on total mortgages secured of $52.4 million, or 0.08%. The agreement is scheduled to terminate on August 31, 2014, unless renewed or earlier terminated pursuant to the provisions contained therein.
11
3. Earnings (Loss) per Share of Common Stock
The following tables set forth the computation of basic and diluted earnings (loss) per share of common stock for the three and nine months ended September 30, 2013 and 2012. We computed basic earnings (loss) per share for the three and nine months ended September 30, 2013 and 2012 using the weighted average number of shares outstanding during the periods. Diluted earnings per share for the three and nine months ended September 30, 2013 and 2012, reflects additional shares of common stock, related to our convertible senior common stock, that would have been outstanding if dilutive potential shares of common stock had been issued, as well as an adjustment to net income available to common stockholders as applicable to common stockholders that would result from their assumed issuance (dollars in thousands, except per share amounts).
| For the three months ended September 30, |
For the nine months ended September 30, |
|||||||||||||||
| 2013 | 2012 | 2013 | 2012 | |||||||||||||
| Calculation of basic earnings per share of common stock: |
||||||||||||||||
| Net (loss) income available to common stockholders |
$ | (797 | ) | $ | (61 | ) | $ | (2,080 | ) | $ | 6 | |||||
| Denominator for basic weighted average shares of common stock |
14,196,423 | 10,945,379 | 12,613,354 | 10,945,379 | ||||||||||||
|
|
|
|
|
|
|
|
|
|||||||||
| Basic (loss) earnings per share of common stock |
$ | (0.06 | ) | $ | (0.01 | ) | $ | (0.16 | ) | $ | 0.00 | |||||
|
|
|
|
|
|
|
|
|
|||||||||
| Calculation of diluted earnings per share of common stock: |
||||||||||||||||
| Net (loss) income available to common stockholders |
$ | (797 | ) | $ | (61 | ) | $ | (2,080 | ) | $ | 6 | |||||
| Add: Income impact of assumed conversion of senior common stock (1) |
— | — | — | 71 | ||||||||||||
|
|
|
|
|
|
|
|
|
|||||||||
| Net (loss) income available to common stockholders plus assumed conversions |
$ | (797 | ) | $ | (61 | ) | $ | (2,080 | ) | $ | 77 | |||||
| Denominator for basic weighted average shares of common stock |
14,196,423 | 10,945,379 | 12,613,354 | 10,945,379 | ||||||||||||
| Effect of convertible senior common stock (1) |
— | — | — | 77,303 | ||||||||||||
|
|
|
|
|
|
|
|
|
|||||||||
| Denominator for diluted weighted average shares of common stock |
14,196,423 | 10,945,379 | 12,613,354 | 11,022,682 | ||||||||||||
|
|
|
|
|
|
|
|
|
|||||||||
| Diluted (loss) earnings per share of common stock |
$ | (0.06 | ) | $ | (0.01 | ) | $ | (0.16 | ) | $ | 0.00 | |||||
|
|
|
|
|
|
|
|
|
|||||||||
| (1) | Convertible senior common stock was excluded from the calculation of diluted earnings per share for the three and nine months ended September 30, 2013 and the three months ended September 30, 2012 because it was anti-dilutive. Had the convertible senior common stock been included in the calculation, 257,429, 217,010 and 93,871 additional shares would have been included in the diluted weighted average shares of common stock for the three and nine months ended September 30, 2013 and the three months ended September 30, 2012, respectively. |
4. Real Estate and Intangible Assets
Real Estate
The following table sets forth the components of our investments in real estate as of September 30, 2013 and December 31, 2012 (in thousands):
| September 30, 2013 | December 31, 2012 | |||||||
| Real estate: |
||||||||
| Land |
$ | 77,299 | $ | 69,126 | ||||
| Building and improvements |
511,335 | 442,451 | ||||||
| Tenant improvements |
33,847 | 22,176 | ||||||
| Accumulated depreciation |
(76,923 | ) | (65,730 | ) | ||||
|
|
|
|
|
|||||
| Real estate, net |
$ | 545,558 | $ | 468,023 | ||||
|
|
|
|
|
|||||
12
2013 Real Estate Activity
During the nine months ended September 30, 2013, we acquired five properties and completed an expansion of one property, which are summarized below (dollars in thousands):
| Location |
Acquisition/ Expansion Date |
Square Footage | Lease Term | Renewal Options | Total Purchase/ Expansion Price |
Acquisition Expenses |
Annualized Straight Line Rent |
Debt Issued | ||||||||||||||||||||||
| Egg Harbor Township, NJ |
3/28/2013 | 29,257 | 10 years | 1 (5 years) | $ | 5,650 | $ | 152 | $ | 490 | $ | 3,700 | ||||||||||||||||||
| Clintonville, WI (1) |
4/11/2013 | 102,400 | 15 years | N/A | 3,250 | N/A | 961 | — | ||||||||||||||||||||||
| Vance, AL |
5/8/2013 | 170,000 | 10 years | 2 (5 year options) | 13,388 | 186 | 1,173 | — | ||||||||||||||||||||||
| Blaine, MN |
5/10/2013 | 92,275 | 6.9 years | 2 (5 year options) | 14,450 | 79 | 1,475 | 8,200 | ||||||||||||||||||||||
| Austin, TX |
7/9/2013 | 320,000 | 8 years | 3 (3 year options) | 57,000 | 155 | 4,641 | 35,300 | ||||||||||||||||||||||
| Allen, TX |
7/10/2013 | 115,200 | 11.5 years | 2 (5 year options) | 15,150 | 81 | 1,478 | 8,900 | ||||||||||||||||||||||
|
|
|
|
|
|
|
|
|
|
|
|||||||||||||||||||||
| Total |
829,132 | $ | 108,888 | $ | 653 | $ | 10,218 | $ | 56,100 | |||||||||||||||||||||
|
|
|
|
|
|
|
|
|
|
|
|||||||||||||||||||||
| (1) | The Clintonville, WI property was originally acquired in November 2005 for $5.3 million. After the expansion completed in April 2013, the total investment in the property is $8.6 million. |
In accordance with ASC 805, we determined the fair value of the acquired assets related to the five properties acquired during the nine months ended September 30, 2013 as follows (in thousands):
| Land | Building | Tenant Improvements |
In-place Leases |
Leasing Costs | Customer Relationships |
Above Market Leases |
Below Market Leases |
Total Purchase Price |
||||||||||||||||||||||||||||
| Egg Harbor Township, NJ |
$ | 1,627 | $ | 2,735 | $ | 282 | $ | 558 | $ | 189 | $ | 259 | $ | — | $ | — | $ | 5,650 | ||||||||||||||||||
| Vance, AL |
457 | 9,721 | 808 | 1,097 | 678 | 627 | — | — | 13,388 | |||||||||||||||||||||||||||
| Blaine, MN |
1,060 | 9,347 | 1,172 | 1,361 | 694 | 816 | — | — | 14,450 | |||||||||||||||||||||||||||
| Austin, TX |
2,330 | 37,207 | 6,814 | 6,118 | 1,906 | 3,793 | — | (1,168 | ) | 57,000 | ||||||||||||||||||||||||||
| Allen, TX |
2,699 | 5,758 | 2,187 | 1,525 | 1,146 | 1,499 | 336 | — | 15,150 | |||||||||||||||||||||||||||
|
|
|
|
|
|
|
|
|
|
|
|
|
|
|
|
|
|
|
|||||||||||||||||||
| $ | 8,173 | $ | 64,768 | $ | 11,263 | $ | 10,659 | $ | 4,613 | $ | 6,994 | $ | 336 | $ | (1,168 | ) | $ | 105,638 | ||||||||||||||||||
|
|
|
|
|
|
|
|
|
|
|
|
|
|
|
|
|
|
|
|||||||||||||||||||
Below is a summary of the total revenue and earnings recognized on the five properties acquired during the nine months ended September 30, 2013 (dollars in thousands):
| Rental Revenue | Net Income | |||||||||||||||||||
| Location |
Acquisition Date | For the three months ended September 30, 2013 |
For the nine months ended September 30, 2013 |
For the three months ended September 30, 2013(1) |
For the nine months ended September 30, 2013(1) |
|||||||||||||||
| Egg Harbor Township, NJ |
3/28/2013 | $ | 122 | $ | 250 | $ | 61 | $ | 130 | |||||||||||
| Vance, AL |
5/8/2013 | 293 | 464 | 147 | 218 | |||||||||||||||
| Blaine, MN |
5/10/2013 | 369 | 579 | 161 | 256 | |||||||||||||||
| Austin, TX |
7/9/2013 | 1,098 | 1,098 | 297 | 297 | |||||||||||||||
| Allen, TX |
7/10/2013 | 325 | 325 | 136 | 136 | |||||||||||||||
|
|
|
|
|
|
|
|
|
|||||||||||||
| $ | 2,207 | $ | 2,716 | $ | 802 | $ | 1,037 | |||||||||||||
|
|
|
|
|
|
|
|
|
|||||||||||||
| (1) | Earnings is calculated as net income less interest expense and acquisition related costs that are required to be expensed under ASC 805. |
13
Pro Forma
We acquired five properties during the nine months ended September 30, 2013. The following table reflects pro-forma condensed consolidated statements of operations as if the properties were acquired as of the beginning of the previous period. The pro-forma earnings for the three and nine months ended September 30, 2013, were adjusted to exclude $0.2 million and $0.6 million, respectively, of acquisition-related costs incurred during 2013 (dollars in thousands, except per share data):
| For the three months ended September 30, |
For the nine months ended September 30, |
|||||||||||||||
| 2013 | 2012 | 2013 | 2012 | |||||||||||||
| (unaudited) | (unaudited) | |||||||||||||||
| Operating Data: |
||||||||||||||||
| Total operating revenue |
$ | 16,314 | $ | 15,720 | $ | 48,744 | $ | 47,109 | ||||||||
| Total operating expenses |
(8,502 | ) | (8,066 | ) | (25,901 | ) | (24,861 | ) | ||||||||
| Other expenses |
(7,287 | ) | (6,718 | ) | (21,520 | ) | (19,659 | ) | ||||||||
|
|
|
|
|
|
|
|
|
|||||||||
| Net income |
525 | 936 | 1,323 | 2,589 | ||||||||||||
| Dividends attributable to preferred and senior common stock |
(1,106 | ) | (1,053 | ) | (3,275 | ) | (3,141 | ) | ||||||||
|
|
|
|
|
|
|
|
|
|||||||||
| Net (loss) income available to common stockholders |
$ | (581 | ) | $ | (117 | ) | $ | (1,952 | ) | $ | (552 | ) | ||||
|
|
|
|
|
|
|
|
|
|||||||||
| Share and Per Share Data: |
||||||||||||||||
| Basic & diluted (loss) earnings per share of common stock |
$ | (0.04 | ) | $ | (0.01 | ) | $ | (0.15 | ) | $ | (0.05 | ) | ||||
| Diluted earnings per share of common stock |
$ | (0.04 | ) | $ | (0.01 | ) | $ | (0.15 | ) | $ | (0.05 | ) | ||||
| Weighted average shares outstanding-basic |
14,196,423 | 10,945,379 | 12,613,354 | 10,945,379 | ||||||||||||
| Weighted average shares outstanding-diluted |
14,196,423 | 10,945,379 | 12,613,354 | 10,945,379 | ||||||||||||
2012 Real Estate Activity
During the nine months ended September 30, 2012, we acquired six properties, which are summarized below (dollars in thousands):
| Location |
Acquisition Date | Square Footage | Lease Term |
Renewal Options |
Total Purchase Price |
Acquisition Expenses |
Annualized Straight Line Rent |
Debt Issued / Assumed |
||||||||||||||||||||
| Ashburn, VA |
1/25/2012 | 52,130 | 15 years | 2 (5 years each) | $ | 10,775 | $ | 102 | $ | 989 | N/A | |||||||||||||||||
| Ottumwa, IA |
5/30/2012 | 352,860 | 11.5 years | 3 (5 years each) | 7,100 | 47 | 684 | 5,000 | ||||||||||||||||||||
| New Albany, OH |
6/5/2012 | 89,000 | 10.5 years | 2 (5 years each) | 13,333 | 188 | 1,361 | N/A | ||||||||||||||||||||
| Columbus, GA |
6/21/2012 | 32,000 | 11.5 years | 2 (5 years each) | 7,320 | 126 | 656 | 4,750 | ||||||||||||||||||||
| Columbus, OH |
6/28/2012 | 31,293 | 10 years | N/A | 4,037 | 59 | 342 | N/A | ||||||||||||||||||||
| Jupiter, FL |
9/26/2012 | 60,000 | 10.5 years | 2 (5 years each) | 15,500 | 55 | 1,372 | 10,758 | ||||||||||||||||||||
|
|
|
|
|
|
|
|
|
|
|
|||||||||||||||||||
| 617,283 | $ | 58,065 | $ | 577 | $ | 5,404 | $ | 20,508 | ||||||||||||||||||||
|
|
|
|
|
|
|
|
|
|
|
|||||||||||||||||||
In accordance with ASC 805, we determined the fair value of acquired assets related to the six properties acquired during the nine months ended September 30, 2012 as follows (in thousands):
| Land | Building | Tenant Improvements |
In-place Leases |
Leasing Costs |
Customer Relationships |
Above Market Leases |
Below Market Leases |
Discount on Assumed Debt |
Total Purchase Price |
|||||||||||||||||||||||||||||||
| Ashburn, VA |
$ | 706 | $ | 6,551 | $ | 1,307 | $ | 804 | $ | 908 | $ | 499 | $ | — | $ | — | $ | — | $ | 10,775 | ||||||||||||||||||||
| Ottumwa, IA |
212 | 4,743 | 329 | 940 | 484 | 499 | — | (107 | ) | — | 7,100 | |||||||||||||||||||||||||||||
| New Albany, OH |
1,658 | 7,511 | 1,235 | 1,122 | 857 | 903 | 47 | — | — | 13,333 | ||||||||||||||||||||||||||||||
| Columbus, GA |
1,378 | 3,894 | 626 | 574 | 473 | 375 | — | — | — | 7,320 | ||||||||||||||||||||||||||||||
| Columbus, OH |
542 | 1,856 | 597 | 391 | 213 | 325 | 113 | — | — | 4,037 | ||||||||||||||||||||||||||||||
| Jupiter, FL |
1,160 | 11,249 | 745 | 1,603 | 701 | 909 | — | — | (867 | ) | 15,500 | |||||||||||||||||||||||||||||
|
|
|
|
|
|
|
|
|
|
|
|
|
|
|
|
|
|
|
|
|
|||||||||||||||||||||
| $ | 5,656 | $ | 35,804 | $ | 4,839 | $ | 5,434 | $ | 3,636 | $ | 3,510 | $ | 160 | $ | (107 | ) | $ | (867 | ) | $ | 58,065 | |||||||||||||||||||
|
|
|
|
|
|
|
|
|
|
|
|
|
|
|
|
|
|
|
|
|
|||||||||||||||||||||
14
Below is a summary of the total revenue and earnings recognized on the six properties acquired during the nine months ended September 30, 2012 (dollars in thousands):
| Rental Revenue | Net Income | |||||||||||||||||||
| Location |
Acquisition Date |
For the three months ended September 30, 2012 |
For the nine months ended September 30, 2012 |
For the three months ended September 30, 2012(1) |
For the nine months ended September 30, 2012(1) |
|||||||||||||||
| Ashburn, VA |
1/25/2012 | $ | 247 | $ | 678 | $ | 147 | $ | 409 | |||||||||||
| Ottumwa, IA |
5/30/2012 | 173 | 235 | 85 | 116 | |||||||||||||||
| New Albany, OH |
6/5/2012 | 339 | 437 | 197 | 248 | |||||||||||||||
| Columbus, GA |
6/21/2012 | 164 | 182 | 88 | 98 | |||||||||||||||
| Columbus, OH |
6/28/2012 | 83 | 86 | 31 | 34 | |||||||||||||||
| Jupiter, FL |
9/26/2012 | 19 | 19 | 10 | 10 | |||||||||||||||
|
|
|
|
|
|
|
|
|
|||||||||||||
| $ | 1,025 | $ | 1,637 | $ | 558 | $ | 915 | |||||||||||||
|
|
|
|
|
|
|
|
|
|||||||||||||
| (1) | Earnings is calculated as net income less interest expense and acquisition related costs that are required to be expensed under ASC 805 |
The weighted average amortization periods in years for the intangible assets acquired and liabilities assumed during the nine months ended September 30, 2013 and 2012, respectively, were as follows:
| Intangible Assets & Liabilities |
2013 | 2012 | ||||||
| In-place leases |
8.8 | 10.7 | ||||||
| Leasing costs |
8.8 | 10.7 | ||||||
| Customer relationships |
13.5 | 15.1 | ||||||
| Above market leases |
8.8 | 10.1 | ||||||
| Below market leases |
7.2 | 11.3 | ||||||
|
|
|
|
|
|||||
| All intangible assets & liabilities |
9.9 | 12.1 | ||||||
|
|
|
|
|
|||||
Future Lease Payments
Future operating lease payments from tenants under non-cancelable leases, excluding tenant reimbursement of expenses, for the remainder of 2013 and each of the five succeeding fiscal years and thereafter is as follows (in thousands):
| Year |
Tenant Lease Payments |
|||
| Three Months ending December 31, 2013 |
$ | 14,727 | ||
| 2014 |
59,940 | |||
| 2015 |
59,267 | |||
| 2016 |
56,272 | |||
| 2017 |
54,641 | |||
| 2018 |
52,850 | |||
| Thereafter |
279,421 | |||
In accordance with the lease terms, substantially all operating expenses are required to be paid by the tenant; however, we would be required to pay property taxes on the respective properties in the event the tenants fail to pay them. The total annual property taxes for all properties owned by us as of September 30, 2013, were $10.2 million.
15
Existing Real Estate Activity
On January 14, 2013, we extended the lease with the tenant occupying our property located in Champaign, Illinois. The lease covering this property was extended for an additional 11 years through December 2024. The lease was originally set to expire in December 2013. The lease provides for prescribed rent escalations over the life of the lease, with annualized straight line rents of approximately $1.4 million. In connection with the extension of the lease and the modification of certain terms under the lease, we paid $0.4 million in leasing commissions.
On April 10, 2013, we extended the lease with the tenant occupying our property located in Akron, Ohio. The lease covering this property was extended for an additional 10 years, through January 2024. The lease was originally set to expire in January 2014. The lease provides for prescribed rent escalations over the life of the lease, with annualized straight line rents of approximately $0.3 million. In connection with the extension of the lease and the modification of certain terms under the lease, we provided a tenant allowance of $0.5 million.
On April 11, 2013, we funded a $3.3 million 102,400 square foot recently completed expansion of our property located in Clintonville, Wisconsin. In connection with the expansion of the property, we executed a lease amendment to extend the lease for an additional eight years, through October 2028. The lease was originally set to expire in October 2020. The lease was also amended to provide for an increase to the rental income over the life of the lease, with annualized straight line rents of approximately $1.0 million, up from $0.6 million under the original lease.
On May 14, 2013, our tenant occupying our Dayton, Ohio property notified us of their intention to exercise their early termination option. The lease requires the tenant to continue to pay monthly rent through the effective termination date of June 30, 2015.
On July 17, 2013, we executed a revised lease with a tenant to occupy our previously vacant property located in Hazelwood, Missouri. The lease commenced on August 1, 2013 and expires in May 2023. The tenant has two options to purchase the property: one option in March 2017 and the other option in May 2023. The lease provides for prescribed rent escalations over the life of the lease, with annualized straight line rents of approximately $0.2 million. In connection with the extension of the lease and the modification of certain terms under the lease, we paid $0.1 million in leasing commissions and $0.3 million in tenant improvements.
On August 7, 2013, we extended the lease with the tenant occupying our property located in South Hadley, Massachusetts. The lease covering this property was extended for an additional year through January 2015. The lease was originally set to expire in January 2014. The lease provides a scheduled rent increase over the previous lease, with annualized straight line rents of approximately $0.3 million. In connection with the extension of the lease and the modification of certain terms under the lease, we paid $3,400 in leasing commissions.
On August 15, 2013, we extended the lease with the tenant occupying our property located in Lexington, North Carolina. The lease covering this property was extended for an additional 12 years through April 2026. The lease was originally set to expire in April 2014. The lease provides for prescribed rent escalations over the life of the lease, with annualized straight line rents of approximately $0.4 million. In connection with the extension of the lease and the modification of certain terms under the lease, we provided a tenant allowance of $0.05 million, and we paid $0.2 million in leasing commissions
On August 15, 2013, we extended the lease with the tenant occupying our property located in Crenshaw, Pennsylvania. The lease covering this property was extended for an additional 12 years through April 2026. The lease was originally set to expire in April 2014. The lease provides for prescribed rent escalations over the life of the lease, with annualized straight line rents of approximately $0.7 million. In connection with the extension of the lease and the modification of certain terms under the lease, we provided a tenant allowance of $0.08 million, and we paid $0.4 million in leasing commissions.
16
Intangible Assets
The following table summarizes the carrying value of intangible assets and the accumulated amortization for each intangible asset class (in thousands):
| September 30, 2013 | December 31, 2012 | |||||||||||||||
| Lease Intangibles | Accumulated Amortization |
Lease Intangibles | Accumulated Amortization |
|||||||||||||
| In-place leases |
$ | 44,743 | $ | (14,237 | ) | $ | 34,085 | $ | (12,125 | ) | ||||||
| Leasing costs |
29,692 | (8,694 | ) | 24,071 | (7,103 | ) | ||||||||||
| Customer relationships |
33,664 | (9,823 | ) | 26,671 | (8,345 | ) | ||||||||||
|
|
|
|
|
|
|
|
|
|||||||||
| $ | 108,099 | $ | (32,754 | ) | $ | 84,827 | $ | (27,573 | ) | |||||||
|
|
|
|
|
|
|
|
|
|||||||||
The estimated aggregate amortization expense for the remainder of 2013 and for each of the five succeeding fiscal years and thereafter is as follows (in thousands):
| Year |
Estimated Amortization Expense |
|||
| Three Months ending December 31, 2013 |
$ | 2,456 | ||
| 2014 |
9,643 | |||
| 2015 |
9,077 | |||
| 2016 |
8,278 | |||
| 2017 |
8,078 | |||
| 2018 |
7,510 | |||
| Thereafter |
30,303 | |||
17
5. Mortgage Notes Payable and Line of Credit
Our mortgage notes payable and line of credit as of September 30, 2013 and December 31, 2012 are summarized below (dollars in thousands):
| Principal Balance Outstanding | ||||||||||||||||
| Date of Issuance/ Assumption |
Principal Maturity Date |
Stated Interest Rate at September 30, 2013 (1) |
September 30, 2013 | December 31, 2012 | ||||||||||||
| 02/21/06 |
12/01/13 | 5.91 | % | $ | 8,511 | $ | 8,658 | |||||||||
| 02/21/06 |
06/30/14 | 5.20 | % | 17,603 | 17,930 | |||||||||||
| 08/25/05 |
09/01/15 | 5.33 | % | 19,793 | 20,074 | |||||||||||
| 09/12/05 |
09/01/15 | 5.21 | % | 11,664 | 11,821 | |||||||||||
| 09/06/07 |
12/11/15 | 5.81 | % | 4,080 | 4,141 | |||||||||||
| 12/21/05 |
01/08/16 | 5.71 | % | 17,922 | 18,155 | |||||||||||
| 03/29/06 |
04/01/16 | 5.92 | % | 16,507 | 16,669 | |||||||||||
| 04/27/06 |
05/05/16 | 6.58 | % | 12,817 | 13,080 | |||||||||||
| 08/29/08 |
06/01/16 | 6.80 | % | 5,744 | 5,866 | |||||||||||
| 06/20/11 |
06/30/16 | 6.08 | % | 11,210 | 11,341 | |||||||||||
| 11/22/06 |
12/01/16 | 5.76 | % | 13,397 | 13,558 | |||||||||||
| 12/22/06 |
01/01/17 | 5.79 | % | 20,487 | 20,731 | |||||||||||
| 02/08/07 |
03/01/17 | 6.00 | % | 13,775 | 13,775 | |||||||||||
| 06/05/07 |
06/08/17 | 6.11 | % | 14,042 | 14,163 | |||||||||||
| 10/15/07 |
11/08/17 | 6.63 | % | 14,906 | 15,072 | |||||||||||
| 09/26/12 |
07/01/18 | 5.75 | % | 10,550 | 10,707 | |||||||||||
| 11/18/11 |
11/01/18 | 4.50 | % | 4,180 | 4,256 | |||||||||||
| 12/06/11 |
12/06/19 | 6.00 | % | 8,099 | 8,272 | |||||||||||
| 10/28/11 |
11/01/21 | 6.00 | % | 6,971 | 7,068 | |||||||||||
| 04/05/12 |
05/01/22 | 6.10 | % | 18,578 | 18,821 | |||||||||||
| 06/21/12 |
07/06/22 | 5.05 | % | 4,641 | 4,712 | |||||||||||
| 08/03/12 |
07/31/22 | 5.00 | % | 2,932 | 2,979 | |||||||||||
| 07/24/12 |
08/01/22 | 5.60 | % | 9,455 | 9,661 | |||||||||||
| 10/01/12 |
10/01/22 | 4.86 | % | 33,369 | 33,888 | |||||||||||
| 11/21/12 |
12/06/22 | 4.04 | % | 18,673 | 19,000 | |||||||||||
| 03/28/13 |
04/06/23 | 4.16 | % | 3,666 | — | |||||||||||
| 07/03/13 |
08/01/23 | 5.00 | % | 8,191 | — | |||||||||||
| 07/10/13 |
08/01/23 | 4.20 | % | 8,889 | — | |||||||||||
| 07/09/13 |
08/06/23 | 4.81 | % | 35,261 | — | |||||||||||
| 12/15/10 |
12/10/26 | 6.63 | % | 9,650 | 9,983 | |||||||||||
| 05/16/12 |
12/31/26 | 4.30 | % | 2,846 | 2,897 | |||||||||||
| 11/08/12 |
02/01/27 | 5.69 | % | 13,936 | 14,145 | |||||||||||
| 05/30/12 |
05/10/27 | 6.50 | % | 4,725 | 4,883 | |||||||||||
| 06/27/12 |
07/01/29 | 5.10 | % | 1,925 | 1,984 | |||||||||||
|
|
|
|
|
|||||||||||||
| Contractual Fixed-Rate Mortgage Notes Payable: |
$ | 408,995 | $ | 358,290 | ||||||||||||
|
|
|
|
|
|||||||||||||
| Premiums and (Discounts), net: |
767 | 895 | ||||||||||||||
|
|
|
|
|
|||||||||||||
| Total Fixed-Rate Mortgage Notes Payable: |
$ | 409,762 | $ | 359,185 | ||||||||||||
|
|
|
|
|
|||||||||||||
| Variable-Rate Line of Credit: |
||||||||||||||||
| 08/07/13 |
08/07/16 | LIBOR +3.00 | % | $ | 28,900 | $ | 25,000 | |||||||||
|
|
|
|
|
|||||||||||||
| Total Mortgage Notes Payable and Line of Credit |
$ | 438,662 | $ | 384,185 | ||||||||||||
|
|
|
|
|
|||||||||||||
| (1) | The weighted average interest rate on all debt outstanding at September 30, 2013, was approximately 5.36%. |
18
Mortgage Notes Payable
As of September 30, 2013, we had 34 fixed-rate mortgage notes payable, collateralized by a total of 68 properties. Gladstone Commercial Corporation has limited recourse liabilities that could result from any one or more of the following circumstances: a borrower voluntarily filing for bankruptcy, improper conveyance of a property, fraud or material misrepresentation, misapplication or misappropriation of rents, security deposits, insurance proceeds or condemnation proceeds, or physical waste or damage to the property resulting from a borrower’s gross negligence or willful misconduct. We will also indemnify lenders against claims resulting from the presence of hazardous substances or activity involving hazardous substances in violation of environmental laws on a property. The weighted-average interest rate on the mortgage notes payable as of September 30, 2013 was 5.5%.
During the nine months ended September 30, 2013, we issued four long-term mortgages, which are summarized below (dollars in thousands):
| Date of Issuance |
Issuing Bank |
Borrowings | Interest Rate | Maturity Date | ||||||||||
| 3/28/2013 |
Citigroup Global Markets Realty Corp. |
$ | 3,700 | 4.16 | % | 4/6/2023 | ||||||||
| 7/3/2013 |
Prudential Mortgage Capital Company LLC |
8,200 | 5.00 | % | 8/1/2023 | |||||||||
| 7/9/2013 |
Cantor Commercial Real Estate Lending |
35,300 | 4.81 | % | 8/6/2023 | |||||||||
| 7/10/2013 |
Synovus Bank | 8,900 | 4.20 | % | 8/1/2023 | |||||||||
|
|
|
|||||||||||||
| $ | 56,100 | |||||||||||||
|
|
|
|||||||||||||
The fair value of all fixed-rate mortgage notes payable outstanding as of September 30, 2013, was $409.8 million, as compared to the carrying value stated above of $409.0 million. The fair value is calculated based on a discounted cash flow analysis, using interest rates based on management’s estimate of market interest rates on long-term debt with comparable terms. The fair value was calculated using Level 3 inputs of the hierarchy established by ASC 820, “Fair Value Measurements and Disclosures.”
Scheduled principal payments of mortgage notes payable for the remainder of 2013 and each of the five succeeding fiscal years and thereafter are as follows (in thousands):
| Year |
Scheduled Principal Payments |
|||
| Three Months ending December 31, 2013 |
$ | 10,508 | ||
| 2014 |
25,250 | |||
| 2015 |
42,112 | |||
| 2016 |
80,173 | |||
| 2017 |
66,393 | |||
| 2018 |
18,944 | |||
| Thereafter |
165,615 | |||
|
|
|
|||
| $ | 408,995 | |||
|
|
|
|||
19
Line of Credit
In August 2013, we procured a new $60.0 million senior unsecured revolving credit facility, or the New Line of Credit, with Keybank National Association serving as a revolving lender, a letter of credit issuer and an administrative agent and Citizens Bank of Pennsylvania as an additional lender. The New Line of Credit initially matures in August 2016; however, we have a one-year extension option subject to the payment of an extension fee equal to 25 basis points on the initial maturity date and certain other customary conditions. The New Line of Credit replaced the Credit Agreement, dated as of December 28, 2010 with Capital One, N.A., as administrative agent, and the other lenders party thereto, or the Prior Line of Credit. The Prior Line of Credit provided for a senior secured revolving credit facility in the amount of $75.0 million and was originally scheduled to mature on December 28, 2013.
The New Line of Credit has a letter of credit sublimit of up to $20.0 million. In addition, we may expand the New Line of Credit up to a total of $75.0 million upon satisfaction of certain conditions, including obtaining commitments from any one or more lenders, whether or not currently a party to the New Line of Credit, to provide such increased amounts and payment of the associated up front and arrangement fees at the time of such increase. The interest rate per annum applicable to the New Line of Credit is equal to the London Interbank Offered Rate, or LIBOR, plus an applicable margin of up to 3.25%, depending upon our leverage. The leverage ratio used in determining the applicable margin for interest on the New Line of Credit is recalculated quarterly. We are subject to an annual maintenance fee of $0.03 million per year and an unused commitment fee of 25 basis points per year, which accrues quarterly. Our ability to access this source of financing is subject to our continued ability to meet customary lending requirements, such as compliance with financial and operating covenants and our meeting certain lending limits. One such covenant requires us to limit distributions to our stockholders to 100% of our FFO, with acquisition-related costs required to be expensed under ASC 805 added back to FFO. In addition, the maximum amount we may draw under the New Line of Credit is based on a percentage of the value of a pool of unencumbered properties which must meet agreed upon eligibility standards.
If and when long-term mortgages are arranged for properties in the unencumbered pool, the banks will reduce the availability under the New Line of Credit by the amount advanced against that property’s value. Conversely, as we purchase new properties meeting the eligibility standards, we may add these new properties to the unencumbered pool to obtain additional availability under the New Line of Credit. The availability under the New Line of Credit is also reduced by letters of credit used in the ordinary course of business. We may use the advances under the New Line of Credit for both general corporate purposes and the acquisition of new investments.
As of September 30, 2013, there was $28.9 million outstanding under our New Line of Credit at an interest rate of approximately 3.2% and $6.4 million outstanding under letters of credit at a weighted average interest rate of 3.0%. As of September 30, 2013, the maximum additional amount we could draw was $16.2 million. We were in compliance with all covenants under the New Line of Credit as of September 30, 2013. The amount outstanding on the New Line of Credit as of September 30, 2013 approximates fair value, because the debt is short-term.
6. Mandatorily Redeemable Preferred Stock
In February 2012, we completed a public offering of 1,540,000 shares of 7.125% Series C Cumulative Term Preferred Stock, par value $0.001 per share, or the Term Preferred Stock, at a public offering price of $25.00 per share. Gross proceeds of the offering totaled $38.5 million and net proceeds, after deducting offering expenses borne by us, were $36.7 million and were used to repay a portion of outstanding borrowings under our Line of Credit, for acquistions of real estate and for working capital. The Term Preferred Stock is traded under the ticker symbol GOODN on the NASDAQ Global Select Market, or the NASDAQ. The Term Preferred Stock is not convertible into our common stock or any other security of ours. Generally, we may not redeem shares of the Term Preferred Stock prior to January 31, 2016, except in limited circumstances to preserve our status as a REIT. On or after January 31, 2016, we may redeem the shares at a redemption price of $25.00 per share, plus any accumulated and unpaid dividends to and
20
including the date of redemption. The shares of the Term Preferred Stock have a mandatory redemption date of January 31, 2017. We incurred $1.8 million in total offering costs related to these transactions, which have been recorded as deferred financing costs on the condensed consolidated balance sheet and will be amortized over the redemption period ending January 31, 2017.
The Term Preferred Stock is recorded as liability in accordance with ASC 480, “Distinguishing Liabilities from Equity,” which states that mandatorily redeemable financial instruments should be classified as liabilities and therefore the related dividend payments are treated as a component of interest expense in the statement of operations.
The fair value of our Term Preferred Stock as of September 30, 2013, was $40.5 million, as compared to the carrying value stated above of $38.5 million. The fair value is calculated based on the closing share price as of September 30, 2013 of $26.32. The fair value was calculated using Level 1 inputs of the hierarchy established by ASC 820, “Fair Value Measurements and Disclosures.”
7. Commitments and Contingencies
Ground Leases
We are obligated as lessee under three ground leases. Future minimum rental payments due under the terms of these leases for the remainder of 2013 and each of the five succeeding years and thereafter, are as follows (in thousands):
| For the three months ending December 31, |
For the year ended December 31, | |||||||||||||||||||||||||||||||
| Location |
Lease End Date | 2013 | 2014 | 2015 | 2016 | 2017 | 2018 | Thereafter | ||||||||||||||||||||||||
| Tulsa, OK |
Apr-21 | $ | 38 | $ | 153 | $ | 153 | $ | 153 | $ | 153 | $ | 153 | $ | 381 | |||||||||||||||||
| Dartmouth, MA |
May-36 | 44 | 174 | 174 | 174 | 174 | 174 | 3,474 | ||||||||||||||||||||||||
| Springfield, MA |
Feb-30 | 21 | 86 | 86 | 86 | 89 | 90 | 1,064 | ||||||||||||||||||||||||
|
|
|
|
|
|
|
|
|
|
|
|
|
|
|
|||||||||||||||||||
| $ | 103 | $ | 413 | $ | 413 | $ | 413 | $ | 416 | $ | 417 | $ | 4,919 | |||||||||||||||||||
|
|
|
|
|
|
|
|
|
|
|
|
|
|
|
|||||||||||||||||||
Expenses recorded in connection with rental expense incurred for the properties listed above during both the nine months ended September 30, 2013 and 2012 was $0.3 million. Rental expenses are reflected in property operating expenses on the condensed consolidated statements of operations.
8. Stockholders’ Equity
The following table summarizes the changes in our stockholders’ equity for the nine months ended September 30, 2013 (in thousands):
| Preferred Stock |
Senior Common Stock |
Common Stock |
Capital in Excess of Par Value |
Notes Receivable from Employees |
Distributions in Excess of Accumulated Earnings |
Total Stockholders’ Equity |
||||||||||||||||||||||
| Balance at December 31, 2012 |
$ | 2 | $ | — | $ | 11 | $ | 215,470 | $ | (410 | ) | $ | (92,708 | ) | $ | 122,365 | ||||||||||||
|
|
|
|
|
|
|
|
|
|
|
|
|
|
|
|||||||||||||||
| Issuance of senior common stock and common stock, net |
— | — | 3 | 58,689 | — | — | 58,692 | |||||||||||||||||||||
| Repayment of principal on employee notes receivable |
— | — | — | — | 35 | — | 35 | |||||||||||||||||||||
| Distributions declared to common, senior common and preferred stockholders |
— | — | — | — | — | (17,429 | ) | (17,429 | ) | |||||||||||||||||||
| Net income |
— | — | — | — | — | 1,194 | 1,194 | |||||||||||||||||||||
|
|
|
|
|
|
|
|
|
|
|
|
|
|
|
|||||||||||||||
| Balance at September 30, 2013 |
$ | 2 | $ | — | $ | 14 | $ | 274,159 | $ | (375 | ) | $ | (108,943 | ) | $ | 164,857 | ||||||||||||
|
|
|
|
|
|
|
|
|
|
|
|
|
|
|
|||||||||||||||
21
Distributions
Our Board of Directors declared the following distributions per share for the three and nine months ended September 30, 2013 and 2012:
| For the three months ended September 30, | For the nine months ended September 30, | |||||||||||||||
| 2013 | 2012 | 2013 | 2012 | |||||||||||||
| Common Stock |
$ | 0.375 | $ | 0.375 | $ | 1.125 | $ | 1.125 | ||||||||
| Senior Common Stock |
0.2625 | 0.2625 | 0.7875 | 0.7875 | ||||||||||||
| Series A Preferred Stock |
0.4843749 | 0.4843749 | 1.4531247 | 1.4531247 | ||||||||||||
| Series B Preferred Stock |
0.46875 | 0.46875 | 1.4063 | 1.4063 | ||||||||||||
| Series C Preferred Stock (1) |
0.4453125 | 0.4453125 | 1.3359 | 1.1875 | ||||||||||||
| (1) | The Series C Preferred Stock was issued on January 31, 2012. |
Recent Activity
On April 29, 2013, we completed a public offering of 1,265,000 shares of our common stock at a public offering price of $18.90 per share. Gross proceeds of the offering totaled $23.9 million and net proceeds, after deducting offering expenses borne by us, were $22.6 million, which we used to acquire real estate.
On June 24, 2013, we completed a public offering of 1,320,000 shares of our common stock at a public offering price of $18.82 per share. On July 11, 2013, the underwriters partially exercised their option to purchase an additional 158,000 shares of common stock. Gross proceeds of the offering were $27.8 million and net proceeds, after deducting offering expenses borne by us, were $26.3 million, which we used to acquire real estate.
Ongoing Activity
We have an open market sale agreement, or the ATM Program, with Jefferies LLC, or Jefferies, under which we may, from time to time, offer to sell shares of our common stock with an aggregate sales price of up to $25.0 million on the open market through Jefferies, as agent, or to Jefferies, as principal. During the nine months ended September 30, 2013, we raised approximately $7.8 million in gross proceeds under the ATM Program. As of September 30, 2013, we had sold a total of 762,478 shares with aggregate gross proceeds of $14.0 million, and have a remaining capacity to sell up to $11.0 million of common stock under the ATM Program with Jefferies.
In March 2011, we commenced an offering of an aggregate of 3,500,000 shares of our senior common stock, par value $0.001 per share, at a price to the public of $15.00 per share, of which 3,000,000 shares are intended to be offered pursuant to the primary offering and 500,000 shares are intended to be offered pursuant to our senior common distribution reinvestment plan, or the DRIP. We, however, reserve the right to reallocate the number of shares being offered between the primary offering and the DRIP. As of September 30, 2013, we have sold 331,830 shares of senior common stock in this ongoing offering, for gross proceeds of $4.1 million, and issued an additional 6,741 shares of senior common stock under the DRIP program.
22
Notes to Employees
The following table is a summary of the outstanding note issued to an employee of the Adviser for the exercise of stock options (dollars in thousands):
| Date Issued |
Outstanding Balance of Employee Loan at September 30, 2013 |
Outstanding Balance of Employee Loans at December 31, 2012 |
Maturity Date of Note |
Interest Rate on Note |
||||||||||||
| Nov 2006 |
$ | 375 | $ | 410 | Nov 2015 | 8.15 | % | |||||||||
|
|
|
|
|
|||||||||||||
In accordance with ASC 505-10-45-2, “Equity,” receivables from employees for the issuance of capital stock to employees prior to the receipt of cash payment should be reflected in the balance sheet as a reduction to stockholders’ equity. Therefore, this note was recorded as a full recourse loan to the employee and is included in the equity section of the accompanying condensed consolidated balance sheets. As of September 30, 2013, this loan maintained its full recourse status.
9. Subsequent Events
On October 8, 2013, our Board of Directors declared the following monthly distributions:
| Record Date |
Payment Date | Common Stock Distributions per Share |
Series A Preferred Distributions per Share |
Series B Preferred Distributions per Share |
Series C Preferred Distributions per Share |
|||||||||||||
| October 22, 2013 |
October 31, 2013 | $ | 0.125 | $ | 0.1614583 | $ | 0.15625 | $ | 0.1484375 | |||||||||
| November 14, 2013 |
November 29, 2013 | 0.125 | 0.1614583 | 0.15625 | 0.1484375 | |||||||||||||
| December 16, 2013 |
December 31, 2013 | 0.125 | 0.1614583 | 0.15625 | 0.1484375 | |||||||||||||
|
|
|
|
|
|
|
|
|
|||||||||||
| Total |
$ | 0.375 | $ | 0.4843749 | $ | 0.46875 | $ | 0.4453125 | ||||||||||
|
|
|
|
|
|
|
|
|
|||||||||||
| Senior Common Stock Distributions |
||||||
| Payable to the Holders of Record During the Month of: |
Payment Date | Distribution per Share | ||||
| October |
November 7, 2013 | $ | 0.0875 | |||
| November |
December 6, 2013 | 0.0875 | ||||
| December |
January 8, 2014 | 0.0875 | ||||
|
|
|
|||||
| Total |
$ | 0.2625 | ||||
|
|
|
|||||
23
| Item 2. | Management’s Discussion and Analysis of Financial Condition and Results of Operations |
All statements contained herein, other than historical facts, may constitute “forward-looking statements” within the meaning of Section 27A of the Securities Act of 1933, as amended, and Section 21E of the Securities Exchange Act of 1934, as amended, or the Exchange Act. These statements may relate to, among other things, future events or our future performance or financial condition. In some cases, you can identify forward-looking statements by terminology such as “may,” “might,” “believe,” “will,” “provided,” “anticipate,” “future,” “could,” “growth,” “plan,” “intend,” “expect,” “should,” “would,” “if,” “seek,” “possible,” “potential,” “likely” or the negative of such terms or comparable terminology. These forward-looking statements involve known and unknown risks, uncertainties and other factors that may cause our business, financial condition, liquidity, results of operations, funds from operations or prospects to be materially different from any future business, financial condition, liquidity, results of operations, funds from operations or prospects expressed or implied by such forward-looking statements. For further information about these and other factors that could affect our future results, please see the captions titled “Forward-Looking Statements” and “Risk Factors” in our Annual Report on Form 10-K for the year ended December 31, 2012. We caution readers not to place undue reliance on any such forward-looking statements, which are made pursuant to the Private Securities Litigation Reform Act of 1995 and, as such, speak only as of the date made. We undertake no obligation to publicly update or revise any forward-looking statements, whether as a result of new information, future events or otherwise, after the date of this Quarterly Report on Form 10-Q.
All references to “we,” “our,” “us” and the “Company” in this Report mean Gladstone Commercial Corporation and its consolidated subsidiaries, except where the context indicates that the term means only Gladstone Commercial Corporation.
OVERVIEW
General
We are an externally-advised real estate investment trust, or REIT, that was incorporated under the General Corporation Law of the State of Maryland on February 14, 2003, primarily for the purpose of investing in and owning net leased industrial, commercial and retail real property and selectively making long-term industrial and commercial mortgage loans. Our portfolio of real estate is leased to a wide cross section of tenants ranging from small businesses to large public companies, many of which are corporations that do not have publicly-rated debt. We have historically entered into, and intend in the future to enter into, purchase agreements for real estate having triple net leases with terms of approximately 10 to 15 years and built in rental rate increases. Under a triple net lease, the tenant is required to pay all operating, maintenance and insurance costs and real estate taxes with respect to the leased property. We actively communicate with buyout funds, real estate brokers and other third parties to locate properties for potential acquisition or to provide mortgage financing in an effort to build our portfolio. We currently own 85 properties totaling 9.0 million square feet, which have a total gross and net carrying value, including intangible assets, of $730.6 million and $620.9 million, respectively. We do not currently have any mortgage loan receivables outstanding.
Business Environment
The United States, or U.S., has been seeing long-term signs of recovery as the unemployment rate has decreased over the last several months, housing starts and building permits have increased, and prices for single-family homes increased across 20 U.S. cities because of a dwindling surplus in the housing market. However, various signs of weakness are still present in the U.S economy. Vacancy rates in certain markets are still higher than pre-recessionary levels as job growth has yet to return to all areas of the country. Although interest rates have risen significantly since the beginning of the year, they still remain near their historic lows. This continued low interest rate environment is leading to increasing competition for new
24
acquisitions and cap rate compression. However; recent U.S. budget deficit concerns and the budget impasse that resulted in the partial shutdown of the U.S. government in October 2013, have increased the possibility of credit-rating downgrades of the U.S. and economic slowdowns. The uncertainty surrounding the outcome of these decisions and the ability of the U.S. government to raise the federal debt ceiling could cause the ratings agencies to lower the long-term sovereign credit rating on the U.S. again. The sovereign credit rating was previously lowered from “AAA” to “AA+” in August 2011. The impact of this or any further downgrades to the U.S. government’s sovereign credit rating, or its perceived creditworthiness, is inherently unpredictable and could adversely affect the U.S. and global financial markets and economic conditions. There can be no assurance that governmental or other measures to aid economic recovery will be effective. These developments and the government’s credit concerns in general, could cause interest rates and borrowing costs to rise, which may negatively impact our ability to access both the debt and equity markets on favorable terms. In addition, a further decrease to the U.S. credit rating could create broader financial turmoil and uncertainty, which may weigh heavily on our stock price. Continued adverse economic conditions could have a material adverse effect on one or more of our tenants, or our business, financial condition and results of operations.
We continue to focus on increasing our funds from operations, or FFO, by re-leasing vacant space in our portfolio. As of September 30, 2013, we had two fully vacant buildings and one partially vacant building. Our vacant buildings are located in Baytown, Texas and Richmond, Virginia. Our building located in Roseville, Minnesota remains partially vacant. The leases on these three vacancies comprised 3.3% of our total square footage as of September 30, 2013 and the annual carrying costs are approximately $1.0 million. We continue to actively seek new tenants for our Richmond, Virginia, Baytown, Texas and Roseville, Minnesota buildings.
Our ability to make new investments is highly dependent upon our ability to procure external financing. Our principal sources of external financing generally include the issuance of equity securities, long-term mortgage loans secured by properties and borrowings under our line of credit, or the New Line of Credit. The market for long-term mortgages continues to improve and long-term mortgages have become more obtainable. The collateralized mortgage backed securities, or CMBS, market has made a comeback, but it is more conservative and restrictive than it was prior to the recession and uncertainty with regard to interest rates has made the CMBS market less predictable. Consequently, we continue to look to regional banks, insurance companies and other non-bank lenders, in addition to the CMBS market to issue mortgages to finance our real estate activities.
In addition to leverage, we have been active in the equity markets during 2013 by issuing shares of common stock in two separate follow-on public offerings, issuing shares of our senior common stock and issuing shares and under our at-the-market program, or ATM Program, pursuant to an open market sale agreement with Jefferies, LLC, or Jefferies, discussed in more detail below.
Recent Developments
2013 Investment Activities
The following is a summary of our recent acquisitions:
Egg Harbor Township, New Jersey: On March 28, 2013, we acquired a 29,257 square foot office building located in Egg Harbor Township, New Jersey for $5.7 million, excluding related acquisition expenses of $0.2 million. We funded this acquisition with existing cash on hand and the issuance of $3.7 million of mortgage debt on the property. The tenant has leased the property for 10 years and has 1 option to renew the lease for an additional period of 5 years. The lease provides for prescribed rent escalations over the life of the lease, with annualized straight line rents of $0.5 million.
Clintonville, Wisconsin: On April 11, 2013, we funded a $3.3 million, 102,400 square foot expansion of our property located in Clintonville, Wisconsin. In connection with the expansion of the property, we executed a lease amendment to extend the lease for an additional eight years, through October 2028.
25
The lease was originally set to expire in October 2020. The lease was also amended to provide for an increase to the rental income over the life of the lease, with annualized straight line rents of approximately $1.0 million, up from $0.6 million today.
Vance, Alabama: On May 9, 2013, we acquired a 170,000 square foot industrial building located in Vance, Alabama for $13.4 million, excluding related acquisition expenses of $0.2 million. We funded this acquisition with existing cash on hand. The tenant has leased the property for 10 years and has 2 options to renew the lease for additional periods of 5-years each. The lease provides for prescribed rent escalations over the life of the lease, with annualized straight line rents of $1.2 million.
Blaine, Minnesota: On May 10, 2013, we acquired a 92,275 square foot office building located in Blaine, Minnesota for $14.4 million, excluding related acquisition expenses of $0.1 million. We funded this acquisition with existing cash on hand. The tenant has seven years remaining on the lease and has two options to renew the lease for additional periods of five-years each. The lease provides for prescribed rent escalations over the life of the lease, with annualized straight line rents of $1.5 million.
Austin, Texas: On July 9, 2013, we acquired a 320,000 square foot office building located in Austin, Texas for $57.0 million, excluding related acquisition expenses of $0.2 million. We funded this acquisition with cash proceeds from our recent common stock offering and the issuance of $35.3 million of mortgage debt on the property. The tenant has seven years remaining on the lease and has three options to renew the lease for additional periods of three years each. The lease provides for prescribed rent escalations over the life of the lease, with annualized straight line rents of $4.7 million.
Allen, Texas: On July 10, 2013, we acquired an 115,200 square foot office building located in Allen, Texas for $15.2 million, excluding related acquisition expenses of $0.1 million. We funded this acquisition with existing cash on hand and the issuance of $8.9 million of mortgage debt on the property. There are two tenants in this property, the largest of which occupies 73% of the space and has nine years remaining on the lease and has two options to renew the lease for additional periods of five years each. The other tenant has eight years remaining on the lease and also has two options to renew the lease for additional periods of five years each. These two leases provide for prescribed rent escalations over the life of the leases, with annualized straight line rents of $1.5 million.
2013 Financing Activities
The following is a summary of our recent financings:
Citigroup: On March 28, 2013, through a wholly-owned subsidiary, we borrowed $3.7 million pursuant to a long-term note payable from Citigroup Global Markets Realty Corp., which is collateralized by a security interest in one of our properties. The note accrues interest at a fixed rate of 4.16% per year and we may not repay this note prior to the last two months of the term, or we would be subject to a prepayment penalty. The note has a maturity date of April 6, 2023. We used the proceeds from the note to acquire the property in Egg Harbor Township, New Jersey on the same date.
Prudential: On July 3, 2013, through a wholly-owned subsidiary, we borrowed $8.2 million pursuant to a long-term note payable from Prudential Mortgage Capital Company, LLC, which is collateralized by a security interest in one of our properties. The note accrues interest at a fixed rate of 5.0% per year and we may not repay this note prior to the last three months of the term, or we would be subject to a prepayment penalty. The note has a maturity date of August 1, 2023. We used the proceeds from the note to acquire properties.
Cantor Commercial Real Estate: On July 9, 2013, through a wholly-owned subsidiary, we borrowed $35.3 million pursuant to a long-term note payable from Cantor Commercial Real Estate Lending, L.P., which is collateralized by a security interest in one of our properties. The note accrues interest at a fixed rate of 4.81% per year and we may not repay this note prior to the last three months of the term, or we would be subject to a prepayment penalty. The note has a maturity date of August 6, 2023. We used the proceeds from the note to acquire the property in Austin, Texas on the same date.
26
Synovus Bank: On July 10, 2013, through a wholly-owned subsidiary, we borrowed $8.9 million pursuant to a long-term note payable from Synovus Bank, which is collateralized by a security interest in one of our properties. The note accrues interest at a fixed rate of 4.2% per year and we may prepay this note prior to maturity without penalty. The note has a maturity date of August 1, 2023. We used the proceeds from the note to acquire the property in Allen, Texas on the same date.
Keybank Line of Credit: On August 7, 2013, we procured a new $60.0 million senior unsecured revolving credit facility, or the New Line of Credit, with Keybank National Association serving as a revolving lender, a letter of credit issuer and an administrative agent, and Citizens Bank of Pennsylvania as an additional lender. This New Line of Credit has an initial maturity of August 2016, with a one-year extension option contingent upon an extension fee equal to 25 basis points on the initial maturity date, and certain other customary conditions. The interest rate per annum is equal to the London Interbank Offered Rate, or LIBOR, plus an applicable margin of up to 3.25%, depending upon our leverage.
2013 Leasing Activities
The following is a summary of our recent leasing activity:
Champaign, Illinois: On January 14, 2013, we extended the lease with the tenant occupying our property located in Champaign, Illinois. The lease covering this property was extended for an additional 11 years, through December 2024. The lease was originally set to expire in December 2013. The lease provides for prescribed rent escalations over the life of the lease, with annualized straight line rents of approximately $1.4 million. In connection with the extension of the lease and the modification of certain terms under the lease, we paid $0.4 million in leasing commissions.
Akron, Ohio: On April 10, 2013, we extended the lease with the tenant occupying our property located in Akron, Ohio. The lease covering this property was extended for an additional 10 years, through January 2024. The lease was originally set to expire in January 2014. The lease provides for prescribed rent escalations over the life of the lease, with annualized straight line rents of approximately $0.3 million. In connection with the extension of the lease and the modification of certain terms under the lease, we provided a tenant allowance of $0.5 million.
Hazelwood, Missouri: On July 17, 2013, we executed a revised lease with a tenant to occupy our previously vacant property located in Hazelwood, Missouri. The lease commences on August 1, 2013 and expires in May 2023. The tenant has two options to purchase the property: one in March 2017 and the other in May 2023. The lease provides for prescribed rent escalations over the life of the lease, with annualized straight line rents of approximately $0.2 million. In connection with the extension of the lease and the modification of certain terms under the lease, we paid $0.1 million in leasing commissions and $0.3 million in tenant improvements.
South Hadley, Massachusetts: On August 7, 2013, we extended the lease with the tenant occupying our property located in South Hadley, Massachusetts. The lease covering this property was extended for an additional year, through January 2015. The lease was originally set to expire in January 2014. The lease provides a scheduled rent increase over the previous lease, with annualized straight line rents of approximately $0.3 million. In connection with the extension of the lease and the modification of certain terms under the lease, we paid $3,400 in leasing commissions.
Lexington, North Carolina: On August 15, 2013, we extended the lease with the tenant occupying our property located in Lexington, North Carolina. The lease covering this property was extended for an additional 12 years, through April 2026. The lease was originally set to expire in April 2014. The lease provides for prescribed rent escalations over the life of the lease, with annualized straight line rents of approximately $0.4 million. In connection with the extension of the lease and the modification of certain terms under the lease, we provided a tenant allowance of $0.05 million, and we paid $0.2 million in leasing commissions.
27
Crenshaw, Pennsylvania: On August 15, 2013, we extended the lease with the tenant occupying our property located in Crenshaw, Pennsylvania. The lease covering this property was extended for an additional 12 years, through April 2026. The lease was originally set to expire in April 2014. The lease provides for prescribed rent escalations over the life of the lease, with annualized straight line rents of approximately $0.7 million. In connection with the extension of the lease and the modification of certain terms under the lease, we provided a tenant allowance of $0.08 million, and we paid $0.4 million in leasing commissions.
2013 Equity Activities
The equity issuances summarized below were issued under our shelf registration statement (File No. 333-169290) that was effective and on file with the Securities and Exchange Commission at the time of each respective issuance.
Common Equity: During the nine months ended September 30, 2013, we completed two separate public offerings for a total of 2,743,000 shares of our common stock. We issued 1,265,000 shares of common stock in the first offering, which closed on April 29, 2013, at a public offering price of $18.90 per share. Gross proceeds of this offering totaled $23.9 million and net proceeds, after deducting offering expenses and underwriter discounts, were $22.6 million. We issued 1,478,000 shares of common stock in the second offering, which closed on June 24, 2013, with a partial exercise of the over-allotment option closing on July 11, 2013, at a public offering price of $18.82 per share. Gross proceeds of this offering totaled $27.8 million and net proceeds, after deducting offering expenses and underwriter discounts, were $26.3 million. Proceeds from these offerings were used to acquire real estate and for general corporate purposes.
ATM Program: During the nine months ended September 30, 2013, we raised approximately $7.7 million in net proceeds under our ATM Program with Jefferies. We used the proceeds from this offering to fund our acquisition in Egg Harbor Township, New Jersey and for general corporate purposes. Under this agreement we may, from time to time, offer to sell shares of our common stock with an aggregate sales price of up to $25.0 million on the open market through Jefferies, as agent, or to Jefferies, as principal, based upon our instructions (including any price, time or size limits or other customary parameters or conditions that we may impose). Sales of shares of our common stock through Jefferies will be executed by means of ordinary brokers’ transactions on the NASDAQ Global Select Market, or the NASDAQ, or otherwise at market prices, in privately negotiated transactions, crosses or block transactions, as may be agreed between us and Jefferies, including a combination of any of these transactions.
Senior Common Equity: During the nine months ended September 30, 2013, we sold 155,873, shares of our senior common stock at $15.00 per share in an ongoing best-efforts public offering and issued 5,346 shares of our senior common stock under the Dividend Reinvestment Plan, or DRIP, program. The net proceeds, after deducting the underwriting discount and commission were $2.1 million. We can issue up to 3,000,000 shares of senior common stock and the offering will continue until the earlier of March 28, 2015 or the date on which a total of 3,000,000 shares of senior common stock are sold. We have used the proceeds of the offering for general corporate purposes and to acquire additional real estate.
Diversity of Our Portfolio
Gladstone Management Corporation, or our Adviser, seeks to diversify our portfolio to avoid dependence on any one particular tenant, industry or geographic market. By diversifying our portfolio, our Adviser intends to reduce the adverse effect on our portfolio of a single under-performing investment or a downturn in any particular industry or geographic market. The table below reflects the breakdown of our total rental income by tenant industry classification for the nine months ended September 30, 2013 and 2012, respectively (dollars in thousands):
28
| For the nine months ended September 30, | ||||||||||||||||
| 2013 | 2012 | |||||||||||||||
| Industry Classification |
Rental Income | Percentage of Rental Income |
Rental Income | Percentage of Rental Income |
||||||||||||
| Telecommunications |
$ | 7,322 | 16.8 | % | $ | 5,370 | 14.3 | % | ||||||||
| Healthcare |
5,605 | 12.8 | 3,856 | 10.4 | ||||||||||||
| Personal, Food & Miscellaneous Services |
3,899 | 8.9 | 1,411 | 3.8 | ||||||||||||
| Electronics |
3,604 | 8.3 | 4,656 | 12.5 | ||||||||||||
| Automobile |
3,455 | 7.9 | 1,314 | 3.5 | ||||||||||||
| Diversified/Conglomerate Manufacturing |
2,748 | 6.3 | 2,747 | 7.4 | ||||||||||||
| Chemicals, Plastics & Rubber |
2,399 | 5.5 | 2,366 | 6.4 | ||||||||||||
| Beverage, Food & Tobacco |
2,260 | 5.2 | 2,062 | 5.5 | ||||||||||||
| Personal & Non-Durable Consumer Products |
1,937 | 4.4 | 1,851 | 5.0 | ||||||||||||
| Machinery |
1,696 | 3.9 | 1,694 | 4.6 | ||||||||||||
| Containers, Packaging & Glass |
1,650 | 3.8 | 1,758 | 4.7 | ||||||||||||
| Buildings and Real Estate |
1,618 | 3.7 | 1,601 | 4.3 | ||||||||||||
| Printing & Publishing |
1,389 | 3.2 | 1,420 | 3.8 | ||||||||||||
| Oil & Gas |
956 | 2.2 | 953 | 2.6 | ||||||||||||
| Diversified/Conglomerate Services |
933 | 2.1 | 933 | 2.5 | ||||||||||||
| Banking |
866 | 2.0 | 862 | 2.3 | ||||||||||||
| Education |
492 | 1.1 | 1,526 | 4.1 | ||||||||||||
| Childcare |
437 | 1.0 | 437 | 1.2 | ||||||||||||
| Home & Office Furnishings |
397 | 0.9 | 397 | 1.1 | ||||||||||||
|
|
|
|
|
|
|
|
|
|||||||||
| $ | 43,663 | 100.0 | % | $ | 37,214 | 100.0 | % | |||||||||
|
|
|
|
|
|
|
|
|
|||||||||
The table below reflects the breakdown of our total rental income by state for the nine months ended September 30, 2013 and 2012, respectively (dollars in thousands):
| For the nine months ended September 30, |
For the nine months ended September 30, |
|||||||||||||||||||||||
| 2013 | 2012 | |||||||||||||||||||||||
| State |
Number of Leases |
Rental Revenue |
% of Base Rent |
Number of Leases |
Rental Revenue |
% of Base Rent |
||||||||||||||||||
| Ohio |
14 | $ | 6,965 | 16.0 | % | 14 | $ | 6,333 | 17.0 | % | ||||||||||||||
| Texas |
7 | 4,414 | 10.1 | % | 5 | 1,965 | 5.3 | % | ||||||||||||||||
| North Carolina |
7 | 3,584 | 8.2 | % | 7 | 3,585 | 9.6 | % | ||||||||||||||||
| South Carolina |
2 | 3,346 | 7.7 | % | 1 | 1,441 | 3.9 | % | ||||||||||||||||
| Minnesota |
4 | 3,011 | 6.9 | % | 3 | 4,023 | 10.8 | % | ||||||||||||||||
| All Other States |
37 | 22,343 | 51.1 | % | 33 | 19,867 | 53.4 | % | ||||||||||||||||
|
|
|
|
|
|
|
|
|
|
|
|
|
|||||||||||||
| Total |
71 | $ | 43,663 | 100 | % | 63 | $ | 37,214 | 100 | % | ||||||||||||||
|
|
|
|
|
|
|
|
|
|
|
|
|
|||||||||||||
Our Adviser and Administrator
Our Adviser is led by a management team with extensive experience purchasing real estate and originating mortgage loans. Our Adviser is controlled by Mr. David Gladstone, our chairman and chief executive officer. Mr. Gladstone is also the chairman and chief executive officer of our Adviser. Terry Lee Brubaker, our vice chairman and chief operating officer, is also the vice chairman and chief operating officer of our Adviser. Gladstone Administration, LLC, or our Administrator, employs our chief financial officer and treasurer, chief compliance officer, internal counsel and secretary and their respective staffs.
Our Adviser and Administrator also provide investment advisory and administrative services, respectively, to certain of our affiliates, including, but not limited to, Gladstone Capital Corporation and Gladstone Investment Corporation, both publicly-traded business development companies, as well as Gladstone Land
29
Corporation, a publicly traded real estate company. With the exception of Ms. Danielle Jones, our chief financial officer and treasurer, and Mr. Robert Cutlip, our president, all of our executive officers and all of our directors serve as either directors or executive officers, or both, of Gladstone Capital Corporation and Gladstone Investment Corporation. In addition, with the exception of our president, all of our executive officers and all of our directors, with the exception of Mr. David Dullum, serve as either directors or executive officers, or both, of Gladstone Land Corporation. In the future, our Adviser may provide investment advisory services to other companies, both public and private.
Advisory and Administration Agreements
We are externally managed pursuant to contractual arrangements with our Adviser and our Administrator. Our Adviser and Administrator employ all of our personnel and pay their payroll, benefits and general expenses directly. We have an investment advisory agreement with our Adviser, or the Advisory Agreement, and an administration agreement with our Administrator, or the Administration Agreement.
Under the terms of the Advisory Agreement, we are responsible for all expenses incurred for our direct benefit. Examples of these expenses include legal, accounting, interest on short-term debt and mortgages, tax preparation, directors’ and officers’ insurance, stock transfer services, stockholder-related fees, consulting and related fees. In addition, we are also responsible for all fees charged by third parties that are directly related to our business, which include real estate brokerage fees, mortgage placement fees, lease-up fees and transaction structuring fees (although we may be able to pass some or all of such fees on to our tenants and borrowers).
Advisory Agreement
The Advisory Agreement provides for an annual base management fee equal to 2.0% of our total stockholders’ equity, less the recorded value of any preferred stock, or total common stockholders’ equity, and for an incentive fee based on FFO. Our Adviser does not charge acquisition or disposition fees when we acquire or dispose of properties as is common with other externally-advised REITs; however, our Adviser may earn fee income from our borrowers or tenants or other sources.
For purposes of calculating the incentive fee, FFO includes any realized capital gains and capital losses, less any distributions paid on preferred stock and senior common stock, but FFO does not include any unrealized capital gains or losses. The incentive fee would reward our Adviser if our quarterly FFO, before giving effect to any incentive fee, or pre-incentive fee FFO, exceeds 1.75%, or the hurdle rate, of total common stockholders’ equity. We pay our Adviser an incentive fee with respect to our pre-incentive fee FFO quarterly as follows:
| • | no incentive fee in any calendar quarter in which our pre-incentive fee FFO does not exceed the hurdle rate of 1.75% (7% annualized); |
| • | 100% of the amount of the pre-incentive fee FFO that exceeds the hurdle rate, but is less than 2.1875% in any calendar quarter (8.75% annualized); and |
| • | 20% of the amount of our pre-incentive fee FFO that exceeds 2.1875% in any calendar quarter (8.75% annualized). |
30
Quarterly Incentive Fee Based on FFO
Pre-incentive fee FFO
(expressed as a percentage of total common stockholders’ equity)
Percentage of pre-incentive fee FFO allocated to the incentive fee
The incentive fee may be reduced because of a covenant which exists in our Line of Credit agreement which limits distributions to our stockholders to 100% of FFO with acquisition-related costs that are required to be expensed under ASC 805, Business Combinations, added back to FFO. In order to comply with this covenant, our Board of Directors accepted our Adviser’s offer to unconditionally, irrevocably and voluntarily waive on a quarterly basis a portion of the incentive fee for the nine months ended September 30, 2013 and 2012, which allowed us to maintain the current level of distributions to our stockholders. These waived fees may not be recouped by our Adviser in the future. Our Adviser has indicated that it intends to continue to waive all or a portion of the incentive fee in order to support the current level of distributions to our stockholders; however, our Adviser is not required to issue any such waiver, either in whole or in part.
Administration Agreement
Pursuant to the Administration Agreement, we pay for our allocable portion of our Administrator’s overhead expenses incurred while performing its obligations to us, including, but not limited to, rent and the salaries and benefits expenses of our personnel, including our chief financial officer and treasurer, chief compliance officer, internal counsel and secretary, investor relations department and their respective staffs. Our allocable portion of expenses is generally derived by multiplying our Administrator’s total expenses by the percentage of our total assets at the beginning of each quarter in comparison to the total assets of all companies managed by our Adviser under similar agreements.
Critical Accounting Policies
The preparation of our financial statements in accordance with Generally Accepted Accounting Principles in the U.S., or GAAP, requires management to make judgments that are subjective in nature in order to make certain estimates and assumptions. Application of these accounting policies involves the exercise of judgment regarding the use of assumptions as to future uncertainties, and as a result, actual results could materially differ from these estimates. A summary of all of our significant accounting policies is provided in Note 1 to our condensed consolidated financial statements included elsewhere in this Form 10-Q. Below is a summary of accounting polices involving estimates and assumptions that require complex, subjective or significant judgments in their application and that materially affect our results of operations. There were no material changes to our critical accounting policies during the quarter ended September 30, 2013.
Allocation of Purchase Price
When we acquire real estate, we allocate the purchase price to (i) the acquired tangible assets and liabilities, consisting of land, building, tenant improvements and long-term debt and (ii) the identified intangible assets and liabilities, consisting of the value of above-market and below-market leases, in-place leases, unamortized lease origination costs, tenant relationships and capital lease obligations, based in each case on their fair values in accordance with ASC 805, Business Combinations. All expenses related to the acquisition are expensed as incurred.
Our Adviser estimates value using methods similar to those used by independent appraisers (e.g., discounted cash flow analysis). Factors considered by management in its analysis include an estimate of
31
carrying costs during hypothetical expected lease-up periods, considering current market conditions and costs to execute similar leases. Our Adviser also considers information obtained about each property as a result of our pre-acquisition due diligence, marketing and leasing activities in estimating the fair value of the tangible and intangible assets and liabilities acquired. In estimating carrying costs, management also includes real estate taxes, insurance and other operating expenses and estimates of lost rentals at market rates during the hypothetical expected lease-up periods, which primarily range from 9 to 18 months, depending on specific local market conditions. Our Adviser also estimates costs to execute similar leases, including leasing commissions, legal and other related expenses to the extent that such costs are not already incurred in connection with a new lease origination as part of the transaction. Our Adviser also considers the nature and extent of our existing business relationships with the tenant, growth prospects for developing new business with the tenant, the tenant’s credit quality and management’s expectations of lease renewals (including those existing under the terms of the lease agreement), among other factors. A change in any of the assumptions above, which are very subjective, could have a material impact on our results of operations.
The allocation of the purchase price directly affects the following in our condensed consolidated financial statements:
| • | The amount of purchase price allocated to the various tangible and intangible assets on our balance sheet; |
| • | The amounts allocated to the value of above-market and below-market lease values are amortized to rental income over the remaining non-cancelable terms of the respective leases. The amounts allocated to all other tangible and intangible assets are amortized to depreciation or amortization expense. Thus, depending on the amounts allocated between land and other depreciable assets, changes in the purchase price allocation among our assets could have a material impact on our FFO, a metric which is used by many REIT investors to evaluate our operating performance; and |
| • | The period of time over which tangible and intangible assets are depreciated varies greatly, and thus, changes in the amounts allocated to these assets will have a direct impact on our results of operations. Intangible assets are generally amortized over the respective life of the leases, which normally range from 10 to 15 years. Also, we depreciate our buildings over 39 years, but do not depreciate our land. These differences in timing could have a material impact on our results of operations. |
32
Asset Impairment Evaluation
We periodically review the carrying value of each property to determine if circumstances that indicate impairment in the carrying value of the investment exist or that depreciation periods should be modified. In determining if impairment exists, our Adviser considers such factors as our tenants’ payment histories, the financial condition of our tenants, including calculating the current leverage ratios of tenants, the likelihood of lease renewal, business conditions in the industries in which our tenants operate and whether the carrying value of our real estate has decreased. If any of the factors above indicate the possibility of impairment, we prepare a projection of the undiscounted future cash flows, without interest charges, of the specific property and determine if the carrying amount of such property is recoverable. In preparing the projection of undiscounted future cash flows, we estimate the holding periods of the properties and cap rates using information that we obtain from market comparability studies and other comparable sources. If impairment were indicated, the carrying value of the property would be written down to its estimated fair value based on our best estimate of the property’s discounted future cash flows using assumptions from market participants. Any material changes to the estimates and assumptions used in this analysis could have a significant impact on our results of operations, as the changes would impact our determination of whether impairment is deemed to have occurred and the amount of impairment loss that we would recognize.
Using the methodology discussed above we evaluated our entire portfolio as of September 30, 2013 for any impairment indicators and performed an impairment analysis on those select properties that had an indication of impairment. We concluded that none of our properties were impaired as of September 30, 2013; however, we determined that our property located in South Hadley, Massachusetts may become impaired in the future. We recently extended the lease on this property for one year, and it now expires in January 2015. There is a possibility we may have to impair the property in 2014 if we do not negotiate another lease extension on this building or find a replacement tenant.
We will continue to monitor our portfolio for any other indicators of impairment. There have been no impairments recognized on our real estate assets since inception.
Results of Operations
The weighted-average yield on our total portfolio, which was 8.8% as of September 30, 2013, is calculated by taking the annualized straight-line rents, reflected as rental income on our condensed consolidated statements of operations, of each acquisition as a percentage of the acquisition. The weighted-average yield does not account for the interest expense incurred on the mortgages placed on our properties.
33
A comparison of our operating results for the three and nine months ended September 30, 2013 and 2012 is below (dollars in thousands, except per share data):
| For the three months ended September 30, | ||||||||||||||||
| 2013 | 2012 | $ Change | % Change | |||||||||||||
| Operating revenues |
||||||||||||||||
| Rental income |
$ | 15,807 | $ | 12,878 | $ | 2,929 | 23 | % | ||||||||
| Tenant recovery revenue |
383 | 92 | 291 | 316 | % | |||||||||||
|
|
|
|
|
|
|
|
|
|||||||||
| Total operating revenues |
16,190 | 12,970 | 3,220 | 25 | % | |||||||||||
|
|
|
|
|
|
|
|
|
|||||||||
| Operating expenses |
||||||||||||||||
| Depreciation and amortization |
6,253 | 4,276 | 1,977 | 46 | % | |||||||||||
| Property operating expenses |
864 | 345 | 519 | 150 | % | |||||||||||
| Acquisition related expense |
163 | 117 | 46 | 39 | % | |||||||||||
| Base management fee |
559 | 355 | 204 | 57 | % | |||||||||||
| Incentive fee |
1,138 | 927 | 211 | 23 | % | |||||||||||
| Administration fee |
274 | 272 | 2 | 1 | % | |||||||||||
| General and administrative |
377 | 343 | 34 | 10 | % | |||||||||||
|
|
|
|
|
|
|
|
|
|||||||||
| Total operating expenses before credit from Adviser |
9,628 | 6,635 | 2,993 | 45 | % | |||||||||||
|
|
|
|
|
|
|
|
|
|||||||||
| Credit to incentive fee |
(989 | ) | (535 | ) | (454 | ) | 85 | % | ||||||||
|
|
|
|
|
|
|
|
|
|||||||||
| Total operating expenses |
8,639 | 6,100 | 2,539 | 42 | % | |||||||||||
|
|
|
|
|
|
|
|
|
|||||||||
| Other income (expense) |
||||||||||||||||
| Interest expense |
(6,573 | ) | (5,229 | ) | (1,344 | ) | 26 | % | ||||||||
| Distributions attributable to mandatorily redeemable preferred stock |
(686 | ) | (686 | ) | — | 0 | % | |||||||||
| Other income |
17 | 37 | (20 | ) | -54 | % | ||||||||||
|
|
|
|
|
|
|
|
|
|||||||||
| Total other expense |
(7,242 | ) | (5,878 | ) | (1,364 | ) | 23 | % | ||||||||
|
|
|
|
|
|
|
|
|
|||||||||
| Net income |
309 | 992 | (683 | ) | -69 | % | ||||||||||
|
|
|
|
|
|
|
|
|
|||||||||
| Distributions attributable to preferred stock |
(1,023 | ) | (1,023 | ) | — | 0 | % | |||||||||
| Distributions attributable to senior common stock |
(83 | ) | (30 | ) | (53 | ) | 177 | % | ||||||||
|
|
|
|
|
|
|
|
|
|||||||||
| Net loss available to common stockholders |
$ | (797 | ) | $ | (61 | ) | $ | (736 | ) | 1207 | % | |||||
|
|
|
|
|
|
|
|
|
|||||||||
| Net loss available to common stockholders per weighted average share of common stock - diluted |
(0.06 | ) | $ | (0.01 | ) | $ | (0.05 | ) | 500 | % | ||||||
|
|
|
|
|
|
|
|
|
|||||||||
| FFO available to common stockholders |
$ | 5,456 | $ | 4,215 | $ | 1,241 | 29 | % | ||||||||
|
|
|
|
|
|
|
|
|
|||||||||
| FFO per weighted average share of common stock - diluted |
$ | 0.38 | $ | 0.38 | $ | — | 0 | % | ||||||||
|
|
|
|
|
|
|
|
|
|||||||||
34
| For the nine months ended September 30, | ||||||||||||||||
| 2013 | 2012 | $ Change | % Change | |||||||||||||
| Operating revenues |
||||||||||||||||
| Rental income |
$ | 43,663 | $ | 37,214 | $ | 6,449 | 17 | % | ||||||||
| Tenant recovery revenue |
819 | 264 | 555 | 210 | % | |||||||||||
|
|
|
|
|
|
|
|
|
|||||||||
| Total operating revenues |
44,482 | 37,478 | 7,004 | 19 | % | |||||||||||
|
|
|
|
|
|
|
|
|
|||||||||
| Operating expenses |
||||||||||||||||
| Depreciation and amortization |
16,374 | 12,172 | 4,202 | 35 | % | |||||||||||
| Property operating expenses |
2,164 | 1,031 | 1,133 | 110 | % | |||||||||||
| Acquisition related expense |
622 | 805 | (183 | ) | -23 | % | ||||||||||
| Base management fee |
1,363 | 1,120 | 243 | 22 | % | |||||||||||
| Incentive fee |
3,001 | 2,614 | 387 | 15 | % | |||||||||||
| Administration fee |
1,004 | 846 | 158 | 19 | % | |||||||||||
| General and administrative |
1,243 | 1,130 | 113 | 10 | % | |||||||||||
|
|
|
|
|
|
|
|
|
|||||||||
| Total operating expenses before credit to incentive fee |
25,771 | 19,718 | 6,053 | 31 | % | |||||||||||
|
|
|
|
|
|
|
|
|
|||||||||
| Credit to incentive fee |
(2,491 | ) | (1,794 | ) | (697 | ) | 39 | % | ||||||||
|
|
|
|
|
|
|
|
|
|||||||||
| Total operating expenses |
23,280 | 17,924 | 5,356 | 30 | % | |||||||||||
|
|
|
|
|
|
|
|
|
|||||||||
| Other income (expense) |
||||||||||||||||
| Interest expense |
(17,998 | ) | (14,687 | ) | (3,311 | ) | 23 | % | ||||||||
| Distributions attributable to Series C mandatorily redeemable preferred stock |
(2,057 | ) | (1,829 | ) | (228 | ) | 12 | % | ||||||||
| Other income |
47 | 109 | (62 | ) | -57 | % | ||||||||||
|
|
|
|
|
|
|
|
|
|||||||||
| Total other expense |
(20,008 | ) | (16,407 | ) | (3,601 | ) | 22 | % | ||||||||
|
|
|
|
|
|
|
|
|
|||||||||
| Net income |
1,194 | 3,147 | (1,953 | ) | -62 | % | ||||||||||
|
|
|
|
|
|
|
|
|
|||||||||
| Distributions attributable to Series A and B preferred stock |
(3,070 | ) | (3,070 | ) | — | 0 | % | |||||||||
| Distributions attributable to senior common stock |
(204 | ) | (71 | ) | (133 | ) | 187 | % | ||||||||
|
|
|
|
|
|
|
|
|
|||||||||
| Net (loss) income available to common stockholders |
$ | (2,080 | ) | $ | 6 | $ | (2,086 | ) | -34767 | % | ||||||
|
|
|
|
|
|
|
|
|
|||||||||
| Net (loss) income available to common stockholders per weighted average share of common stock - diluted |
$ | (0.16 | ) | $ | 0.00 | $ | (0.16 | ) | NM | (1) | ||||||
|
|
|
|
|
|
|
|
|
|||||||||
| FFO available to common stockholders |
$ | 14,294 | $ | 12,178 | $ | 2,116 | 17 | % | ||||||||
|
|
|
|
|
|
|
|
|
|||||||||
| FFO per weighted average share of common stock - diluted |
$ | 1.11 | $ | 1.10 | $ | 0.01 | 1 | % | ||||||||
|
|
|
|
|
|
|
|
|
|||||||||
| (1) | NM = Not meaningful |
Operating Revenues
Rental income increased for both the three and nine months ended September 30, 2013, as compared to the three and nine months ended September 30, 2012, because of the seven properties acquired subsequent to September 30, 2012, partially offset by a loss of rental income due to vacancies in our portfolio subsequent to September 30, 2012.
Tenant recovery revenue increased for both the three and nine months ended September 30, 2013, as compared to the three and nine months ended September 30, 2012. This increase was primarily due to reimbursements from our tenant in our partially vacant building located in Roseville, Minnesota.
Operating Expenses
Depreciation and amortization expenses increased for the three and nine months ended September 30, 2013, as compared to the three and nine months ended September 30, 2012, because of the seven properties acquired subsequent to September 30, 2012.
Property operating expenses consist of franchise taxes, management fees, insurance, ground lease payments and overhead expenses paid on behalf of certain of our properties. Property operating expenses increased for both the three and nine months ended September 30, 2013, as compared to the three and nine months ended September 30, 2012, primarily because of an increase in overhead expenses at our partially vacant Roseville, Minnesota building.
Acquisition related expense primarily consists of legal fees and fees incurred for third-party reports prepared in connection with potential acquisitions and our due diligence analyses related thereto. Acquisition related expense increased for the three months ended September 30, 2013, as compared to the
35
three months ended September 30, 2012, as a result of acquiring two properties during the three months ended September 30, 2013, as compared to acquiring only one property during the three months ended September 30, 2012. Acquisition related expense decreased for the nine months ended September 30, 2013 as compared to the nine months ended September 30, 2012, as a result of acquiring five properties during the nine months ended September 30, 2013, as compared to the six properties acquired during the nine months ended September 30, 2012.
The base management fee increased for the three and nine months ended September 30, 2013, as compared to the three and nine months ended September 30, 2012, due to an increase in total common stockholders’ equity, the main component of the calculation. The calculation of the base management fee is described in detail above under “Advisory and Administration Agreements.”
The incentive fee increased for both the three and nine months ended September 30, 2013, as compared to the three and nine months ended September 30, 2012, because of an increase in pre-incentive fee FFO. The increase in pre-incentive fee FFO was due to an increase in rental revenues from the acquisitions acquired subsequent to September 30, 2012, which was partially offset by an increase in property operating and interest expenses during the three and nine months ended September 30, 2013, as compared to the three and nine months ended September 30, 2012.
The incentive fee credit increased for both the three and nine months ended September 30, 2013, as compared to the three and nine months ended September 30, 2012, because of an increase in the amount of common dividends paid from the shares issued during 2013. The calculation of the incentive fee is described in detail above within “Advisory and Administration Agreements.”
The administration fee increased for both the three and nine months ended September 30, 2013, as compared to the three and nine months ended September 30, 2012, as a result of an increase in the amount of the total expenses our Administrator incurred during the three and nine months ended September 30, 2013, coupled with a larger percentage of the fee being allocated to us as a result of the increase in our total assets during the last 12 months. The calculation of the administration fee is described in detail above within “Advisory and Administration Agreements.”
General and administrative expenses increased for both the three and nine months ended September 30, 2013, as compared to the three and nine months ended September 30, 2012, as a result of an increase in professional fees related to tax and audit work from the increase in our portfolio.
Other Income and Expenses
Interest expense increased for the three and nine months ended September 30, 2013, as compared to the three and nine months ended September 30, 2012. This increase was primarily a result of interest on the $123.3 million of mortgage debt assumed and issued in the past 12 months, partially offset by reduced interest expense on our long-term financings from amortizing and balloon principal payments made during the last 12 months in connection with certain of our acquisitions made during that time.
Distributions on our mandatorily redeemable preferred stock remained flat for the three months ended September 30, 2013, as compared to the three months ended September 30, 2012, because our mandatorily redeemable preferred stock was outstanding during both periods. Distributions for our mandatorily redeemable preferred stock increased for the nine months ended September 30, 2013, as compared to the nine months ended September 30, 2012, because the public offering of shares of our Term Preferred Stock was completed in February 2012, and thus was not outstanding for the full nine months ended September 30, 2012.
Other income decreased during both the three and nine months ended September 30, 2013, as compared to the three and nine months ended September 30, 2012, because of lower interest income on employee loans earned during the three and nine months ended September 30, 2013, as compared to the three and nine months ended September 30, 2012 due to principal repayments made by employees of our Adviser during the past 12 months.
36
Net (Loss) Income Available to Common Stockholders
Net (loss) income available to common stockholders decreased for both the three and nine months ended September 30, 2013, as compared to the three and nine months ended September 30, 2012, primarily because of increased interest expense, depreciation expense and increased distributions to our preferred stockholders from the issuance of our 7.125% Series C Cumulative Term Preferred Stock, or the Term Preferred Stock, partially offset by an increase in rental income earned from the 7 properties acquired in the past 12 months.
Liquidity and Capital Resources
Overview
Our sources of liquidity include cash flows from operations, cash and cash equivalents, borrowings under our New Line of Credit, obtaining mortgages on our unencumbered properties and issuing additional equity securities. Our available liquidity at September 30, 2013, was $20.7 million, including $4.5 million in cash and cash equivalents and an available borrowing capacity of $16.2 million under our New Line of Credit.
Future Capital Needs
We actively seek conservative investments that are likely to produce income to pay distributions to our stockholders. We intend to use the proceeds received from future equity raised and debt capital borrowed to continue to invest in industrial, commercial and retail real property, make mortgage loans, or pay down outstanding borrowings under our New Line of Credit. Accordingly, to ensure that we are able to effectively execute our business strategy, we routinely review our liquidity requirements and continually evaluate all potential sources of liquidity. Our short-term liquidity needs include proceeds necessary to fund our distributions to stockholders, pay the debt service costs on our existing long-term mortgages, and fund our current operating costs. Our long-term liquidity needs include proceeds necessary to grow and maintain our portfolio of investments.
We believe that our available liquidity is sufficient to fund our distributions to stockholders, pay the debt service costs on our existing long-term mortgages and fund our current operating costs in the near term. Additionally, to satisfy our short-term obligations, we may request credits to our management fees that are issued from our Adviser, although our Adviser is under no obligation to provide any such credits, either in whole or in part. Historically, our Adviser has provided such partial credits to our management fees on a quarterly basis. We further believe that our cash flow from operations coupled with the financing capital available to us in the future are sufficient to fund our long-term liquidity needs.
Equity Capital
During 2013, we raised $51.7 million of common equity in two follow-on public offerings, or $48.9 million in net proceeds, at an average share price of $18.86. We also raised $7.8 million of common equity under our ATM Program, or $7.7 million in net proceeds, at an average share price of $18.72. Furthermore, we raised $2.1 million in net proceeds of senior common equity. We used these proceeds to acquire additional real estate, repay a portion of the outstanding balance of the New Line of Credit, with the remainder used for general corporate and working capital needs.
As of today, we have the ability to raise up to $299.5 million of additional equity capital through the sale and issuance of securities that are registered under our universal shelf registration statement on Form S-3 (File No. 333-190931), or the Universal Shelf, in one or more future public offerings. Of the $299.5 million of available capacity under our Universal Shelf, $11.0 million of common stock is reserved for additional sales under our ATM Program and $47.3 million is reserved for sales of our senior common stock.
37
Debt Capital
As of September 30, 2013, we had fixed-rate mortgage notes payable in the aggregate principal amount of $409.0 million, collateralized by a total of 68 properties with terms at issuance ranging from 5 years to 17 years. The weighted-average interest rate on the mortgage notes payable as of September 30, 2013 was 5.5%.
The CMBS market has returned, see the discussion in “Overview – Business Environment” above. Specifically, we continue to see banks and other non-bank lenders willing to issue 10-year mortgages. Consequently, we are focused on obtaining mortgages through regional banks, non-bank lenders and CMBS.
We have mortgage debt in the aggregate principal amount of $10.5 million payable during the remainder of 2013 and $25.2 million payable during 2014. The 2013 and 2014 principal amounts payable include both amortizing principal payments and balloon principal payments due in December 2013 of $8.5 million and June 2014 of $17.5 million. We have signed a term sheet with a lender to refinance the debt that matures in December of 2013, and anticipate closing on this in the near-term. We are also initiating conversations with other lenders in advance of the maturity in June 2014 and anticipate being able to extend the maturity dates or refinance with new lenders. We intend to pay the 2013 and 2014 debt amortization payments from operating cash flow and borrowings under our New Line of Credit.
Operating Activities
Net cash provided by operating activities during the nine months ended September 30, 2013, was $15.6 million, as compared to net cash provided by operating activities of $18.6 million for the nine months ended September 30, 2012. This decrease was primarily a result of a decrease in our account payables and leasing commissions paid, partially offset by an increase in rental income received from the properties acquired in the past 12 months. The majority of cash from operating activities is generated from the rental payments that we receive from our tenants. We utilize this cash to fund our property-level operating expenses and use the excess cash primarily for debt and interest payments on our mortgage notes payable, interest payments on our New Line of Credit, distributions to our stockholders, management fees to our Adviser, and other entity-level expenses.
Investing Activities
Net cash used in investing activities during the nine months ended September 30, 2013, was $111.0 million, which primarily consisted of the acquisition of five properties, the expansion at another property and tenant improvements performed at certain of our properties during the nine months ended September 30, 2013, as compared to net cash used in investing activities during the nine months ended September 30, 2012, of $55.6 million, which primarily consisted of the acquisition of six properties, coupled with tenant improvements performed at certain of our properties and net payments to our lenders for reserves.
Financing Activities
Net cash provided by financing activities during the nine months ended September 30, 2013, was $94.4 million, which primarily consisted of proceeds from the sale of common stock and proceeds from the issuance of mortgage notes payable, partially offset by the increase in distributions paid to our stockholders and principal repayments on mortgage notes payable. Net cash provided by financing activities for the nine months ended September 30, 2012, was $48.4 million, which primarily consisted of proceeds from the sale of our Term Preferred Stock and proceeds from the issuance of mortgage notes payable, partially offset by distributions paid to our stockholders, principal repayments on mortgage notes payable and net repayments on our Prior Line of Credit.
38
Line of Credit
In August 2013, we procured the $60.0 million New Line of Credit, with Keybank National Association serving as a revolving lender, a letter of credit issuer and an administrative agent and Citizens Bank of Pennsylvania as an additional lender. The New Line of Credit initially matures in August 2016; however, we have a one-year extension option subject to the payment of an extension fee equal to 25 basis points on the initial maturity date and certain other customary conditions. The New Line of Credit replaced the Credit Agreement, dated as of December 28, 2010 with Capital One, N.A., as administrative agent, and the other lenders party thereto, or the Prior Line of Credit. The Prior Line of Credit provided for a senior secured revolving credit facility in the amount of $75.0 million and was originally scheduled to mature on December 28, 2013.
The New Line of Credit has a letter of credit sublimit of up to $20.0 million. In addition, we may expand the New Line of Credit up to a total of $75.0 million upon satisfaction of certain conditions, including obtaining commitments from any one or more lenders, whether or not currently party to the New Line of Credit, to provide such increased amounts and payment of the associated up front and arrangement fees at the time of such increase. The interest rate per annum applicable to the New Line of Credit is equal to the London Interbank Offered Rate, or LIBOR, plus an applicable margin of up to 3.25%, depending upon our leverage. The leverage ratio used in determining the applicable margin for interest on the New Line of Credit is recalculated quarterly. We are subject to an annual maintenance fee of $0.03 million per year and an unused commitment fee of 25 basis points per year, which accrues quarterly. Our ability to access this source of financing is subject to our continued ability to meet customary lending requirements, such as compliance with financial and operating covenants and our meeting certain lending limits. One such covenant requires us to limit distributions to our stockholders to 100% of our FFO, with acquisition-related costs required to be expensed under ASC 805 added back to FFO. In addition, the maximum amount we may draw under the New Line of Credit is based on a percentage of the value of a pool of unencumbered properties, which must meet agreed upon eligibility standards.
If and when long-term mortgages are arranged for properties in the unencumbered pool, the banks will reduce the availability under the New Line of Credit by the amount advanced against that property’s value. Conversely, as we purchase new properties meeting the eligibility standards, we may add these new properties to the unencumbered pool to obtain additional availability under the New Line of Credit. The availability under the New Line of Credit is also reduced by letters of credit used in the ordinary course of business. We may use the advances under the New Line of Credit for both general corporate purposes and the acquisition of new investments.
As of September 30, 2013, there was $28.9 million outstanding under our New Line of Credit at an interest rate of approximately 3.2% and $6.4 million outstanding under letters of credit at a weighted average interest rate of 3.0%. Subsequent to the end of the quarter, we received $2.8 million of letters of credit back, and our current outstanding letters of credit are now $3.6 million. As of November 4, 2013, the maximum additional amount we could draw was $17.6 million. Our ability to increase the availability under our New Line of Credit is dependent upon us adding additional properties to the unencumbered pool, which meet predetermined eligibility standards. We were in compliance with all covenants under the New Line of Credit as of September 30, 2013.
39
Contractual Obligations
The following table reflects our material contractual obligations as of September 30, 2013 (in thousands):
| Payments Due by Period | ||||||||||||||||||||
| Contractual Obligations |
Total | Less than 1 Year | 1-3 Years | 3-5 Years | More than 5 Years | |||||||||||||||
| Debt Obligations (1) |
$ | 476,395 | $ | 62,665 | $ | 110,023 | $ | 133,017 | $ | 170,690 | ||||||||||
| Interest on Debt Obligations (2) |
127,727 | 25,617 | 43,228 | 22,836 | 36,046 | |||||||||||||||
| Operating Lease Obligations (3) |
7,094 | 413 | 825 | 831 | 5,025 | |||||||||||||||
|
|
|
|
|
|
|
|
|
|
|
|||||||||||
| Total |
$ | 611,216 | $ | 88,695 | $ | 154,076 | $ | 156,684 | $ | 211,761 | ||||||||||
|
|
|
|
|
|
|
|
|
|
|
|||||||||||
| (1) | Debt obligations represent borrowings under our New Line of Credit, which represents $28.9 million of the debt obligation due in 2013, mortgage notes payable that were outstanding as of September 30, 2013, and amounts due to the holders of our Term Preferred Stock. |
| (2) | Interest on debt obligations includes estimated interest on our borrowings under our New Line of Credit, mortgage notes payable and interest due to the holders of our Term Preferred Stock. The balance and interest rate on our New Line of Credit is variable; thus, the amount of interest calculated for purposes of this table was based upon rates and balances as of September 30, 2013. |
| (3) | Operating lease obligations represent the ground lease payments due on our Tulsa, Oklahoma, Dartmouth, Massachusetts, and Springfield, Missouri properties. |
Off-Balance Sheet Arrangements
We did not have any off-balance sheet arrangements as of September 30, 2013.
Funds from Operations
The National Association of Real Estate Investment Trusts, or NAREIT, developed FFO as a relevant non-GAAP supplemental measure of operating performance of an equity REIT, to recognize that income-producing real estate historically has not depreciated on the same basis determined under GAAP. FFO, as defined by NAREIT, is net income (computed in accordance with GAAP), excluding gains or losses from sales of property and impairment losses on property, plus depreciation and amortization of real estate assets, and after adjustments for unconsolidated partnerships and joint ventures.
FFO does not represent cash flows from operating activities in accordance with GAAP, which, unlike FFO, generally reflects all cash effects of transactions and other events in the determination of net income and should not be considered an alternative to net income as an indication of our performance or to cash flows from operations as a measure of liquidity or ability to make distributions. Comparison of FFO, using the NAREIT definition, to similarly titled measures for other REITs may not necessarily be meaningful due to possible differences in the application of the NAREIT definition used by such REITs.
FFO available to common stockholders is FFO adjusted to subtract distributions made to holders of preferred and senior common stock. We believe that net income available to common stockholders is the most directly comparable GAAP measure to FFO available to common stockholders.
Basic funds from operations per share, or Basic FFO per share, and diluted funds from operations per share, or Diluted FFO per share, is FFO available to common stockholders divided by the number of weighted average shares of common stock outstanding and FFO available to common stockholders divided by the number of weighted average shares of common stock outstanding on a diluted basis, respectively, during a period. We believe that FFO available to common stockholders, Basic FFO per share and Diluted FFO per share are useful to investors because they provide investors with a further context for evaluating our FFO results in the same manner that investors use net income and earnings per share, or EPS, in evaluating net income available to common stockholders. In addition, because most REITs provide FFO available to common stockholders, Basic FFO and Diluted FFO per share information to the investment community, we believe these are useful supplemental measures when comparing us to other REITs. We believe that net income is the most directly comparable GAAP measure to FFO, Basic EPS is the most directly comparable GAAP measure to Basic FFO per share, and that diluted EPS is the most directly comparable GAAP measure to Diluted FFO per share.
40
The following table provides a reconciliation of our FFO available to common stockholders for the three and nine months ended September 30, 2013 and 2012, to the most directly comparable GAAP measure, net income available to common stockholders, and a computation of basic and diluted FFO per weighted average share of common stock:
| For the three months ended September 30, |
For the nine months ended September 30, |
|||||||||||||||
| 2013 | 2012 | 2013 | 2012 | |||||||||||||
| (Dollars in Thousands, Except Per Share Data) | (Dollars in Thousands, Except Per Share Data) | |||||||||||||||
| Net income |
$ | 309 | $ | 992 | $ | 1,194 | $ | 3,147 | ||||||||
| Less: Distributions attributable to preferred and senior common stock |
(1,106 | ) | (1,053 | ) | (3,274 | ) | (3,141 | ) | ||||||||
|
|
|
|
|
|
|
|
|
|||||||||
| Net (loss) income available to common stockholders |
$ | (797 | ) | $ | (61 | ) | $ | (2,080 | ) | $ | 6 | |||||
| Add: Real estate depreciation and amortization |
6,253 | 4,276 | 16,374 | 12,172 | ||||||||||||
|
|
|
|
|
|
|
|
|
|||||||||
| FFO available to common stockholders |
$ | 5,456 | $ | 4,215 | $ | 14,294 | $ | 12,178 | ||||||||
| Weighted average common shares outstanding - basic |
14,196,423 | 10,945,379 | 12,613,354 | 10,945,379 | ||||||||||||
| Weighted average common shares outstanding - diluted |
14,453,852 | 11,039,250 | 12,830,364 | 11,022,682 | ||||||||||||
| Diluted net (loss) income per weighted average share of common stock |
$ | (0.06 | ) | $ | (0.01 | ) | $ | (0.16 | ) | $ | 0.00 | |||||
|
|
|
|
|
|
|
|
|
|||||||||
| Basic FFO per weighted average share of common stock |
$ | 0.38 | $ | 0.39 | $ | 1.13 | $ | 1.11 | ||||||||
|
|
|
|
|
|
|
|
|
|||||||||
| Diluted FFO per weighted average share of common stock |
$ | 0.38 | $ | 0.38 | $ | 1.11 | $ | 1.10 | ||||||||
|
|
|
|
|
|
|
|
|
|||||||||
| Distributions declared per share of common stock |
$ | 0.375 | $ | 0.375 | $ | 1.125 | $ | 1.125 | ||||||||
|
|
|
|
|
|
|
|
|
|||||||||
41
| Item 3. | Quantitative and Qualitative Disclosures About Market Risk. |
Market risk includes risks that arise from changes in interest rates, foreign currency exchange rates, commodity prices, equity prices and other market changes that affect market sensitive instruments. The primary risk that we believe we are and will be exposed to is interest rate risk. Certain of our leases contain escalations based on market indices, and the interest rate on our New Line of Credit is variable. Although we seek to mitigate this risk by structuring such provisions of our loans and leases to contain a minimum interest rate or escalation rate, as applicable, these features do not eliminate this risk. To date, we have not entered into any derivative contracts to attempt to further manage our exposure to interest rate fluctuations.
To illustrate the potential impact of changes in interest rates on our net income for the three and nine months ended September 30, 2013, we have performed the following analysis, which assumes that our balance sheet remains constant and that no further actions beyond a minimum interest rate or escalation rate are taken to alter our existing interest rate sensitivity.
The following table summarizes the annual impact of a 1%, 2% and 3% increase in the one month LIBOR as of September 30, 2013. As of September 30, 2013, our effective average LIBOR was 0.18%; thus, a 1%, 2% or 3% decrease could not occur.
| (Dollars in Thousands) | ||||||||||||
| Interest Rate Change |
Increase to Rental Income |
Increase to Interest Expense |
Net Decrease to Net Income |
|||||||||
| 1% Increase to LIBOR | $ | — | $ | 293 | $ | (293 | ) | |||||
| 2% Increase to LIBOR | — | 586 | (586 | ) | ||||||||
| 3% Increase to LIBOR | — | 879 | (879 | ) | ||||||||
As of September 30, 2013, the fair value of our fixed rate mortgage debt outstanding was $409.8 million. Interest rate fluctuations may affect the fair value of our fixed rate debt instruments. If interest rates on our fixed rate debt instruments, using rates at September 30, 2013, had been one percentage point higher or lower, the fair value of those debt instruments on that date would have decreased or increased by $22.0 million and $12.7 million, respectively.
In the future, we may be exposed to additional effects of interest rate changes, primarily as a result of our New Line of Credit or long-term mortgage debt, which we use to maintain liquidity and fund expansion of our real estate investment portfolio and operations. Our interest rate risk management objectives are to limit the impact of interest rate changes on earnings and cash flows and to lower overall borrowing costs. To achieve these objectives, we will borrow primarily at fixed rates or variable rates with the lowest margins available and, in some cases, with the ability to convert variable rates to fixed rates. We may also enter into derivative financial instruments such as interest rate swaps and caps in order to mitigate the interest rate risk on a related financial instrument. We will not enter into derivative or interest rate transactions for speculative purposes.
In addition to changes in interest rates, the value of our real estate is subject to fluctuations based on changes in local and regional economic conditions and changes in the creditworthiness of lessees and borrowers, all of which may affect our ability to refinance debt, if necessary.
42
Item 4. Controls and Procedures.
a) Evaluation of Disclosure Controls and Procedures
As of September 30, 2013, our management, including our chief executive officer and chief financial officer and treasurer, evaluated the effectiveness of the design and operation of our disclosure controls and procedures (as defined in Exchange Act Rules 13a-15(e) and 15d-15(e)). Based on that evaluation, management, including the chief executive officer and chief financial officer, concluded that our disclosure controls and procedures were effective as of September 30, 2013, in providing a reasonable level of assurance that information we are required to disclose in reports that we file or submit under the Exchange Act is recorded, processed, summarized, and reported within the time periods specified in applicable Securities and Exchange Commission rules and forms, including providing a reasonable level of assurance that information required to be disclosed by us in such reports is accumulated and communicated to our management, including our chief executive officer and our chief financial officer, as appropriate to allow timely decisions regarding required disclosure. However, in evaluating the disclosure controls and procedures, management recognized that any controls and procedures, no matter how well designed and operated can provide only reasonable assurance of necessarily achieving the desired control objectives, and management was required to apply its judgment in evaluating the cost-benefit relationship of possible controls and procedures.
b) Changes in Internal Control over Financial Reporting
There were no changes in our internal control over financial reporting that occurred during the quarter ended September 30, 2013, that have materially affected, or are reasonably likely to materially affect, our internal control over financial reporting.
43
PART II – OTHER INFORMATION
| Item 1. | Legal Proceedings |
Neither we nor any of our subsidiaries are currently subject to any material legal proceedings, nor, to our knowledge, is any material legal proceeding threatened against us or our subsidiaries.
| Item 1A. | Risk Factors |
Our business is subject to certain risks and events that, if they occur, could adversely affect our financial condition and results of operations and the trading price of our securities. For a discussion of these risks, please refer to the section captioned “Item 1A. Risk Factors” in our Annual Report on Form 10-K for the year ended December 31, 2012, filed by us with the Securities and Exchange Commission on February 19, 2013.
The failure of U.S. lawmakers to reach an agreement on the national debt ceiling or a budget could have a material adverse effect on our business, financial condition and results of operations.
On October 16, 2013, the U.S. Congress passed legislation to reopen the government through January 15, 2014 and effectively suspend the debt ceiling through February 7, 2014 to permit broader negotiations over budget issues. In the event U.S. lawmakers fail to reach a viable agreement on the national debt ceiling or a budget, the U.S. could default on its obligations, which could negatively impact the trading market for U.S. government securities. This may, in turn, negatively affect our ability to obtain financing for our investments. As a result, it may materially adversely affect our business, financial condition and results of operations.
On August 5, 2011, Standard & Poor’s downgraded its long-term sovereign credit rating on the U.S. to AA+ for the first time due to the U.S. Congress’ inability to reach an effective agreement on the national debt ceiling and a budget in a timely manner. The current U.S. debt ceiling and budget deficit concerns have increased the possibility of the credit-rating agencies further downgrading the U.S. credit rating. On October 15, 2013, Fitch Ratings Service placed the U.S. credit rating on negative watch, warning that a failure by the U.S. Government to honor interest or principal payments on U.S. treasury securities would impact its decision on whether to downgrade the U.S. credit rating. Fitch also stated that the manner and duration of an agreement to raise the debt ceiling and resolve the budget impasse, as well as the perceived risk of such events occurring in the future, would weigh on its ratings.
The impact of any further downgrades to the U.S. government’s sovereign credit rating, or its perceived creditworthiness, and deteriorating sovereign debt conditions in Europe, is inherently unpredictable and could adversely affect the U.S. and global financial markets and economic conditions. There can be no assurance that governmental or other measures to aid economic recovery will be effective. These developments and the government’s credit concerns in general could cause interest rates and borrowing costs to rise, which may negatively impact our ability to access the debt markets on favorable terms. In addition, the decreased credit rating could create broader financial turmoil and uncertainty, which may weigh heavily on our stock price. Continued adverse economic conditions could have a material adverse effect on our business, financial condition and results of operations.
| Item 2. | Unregistered Sales of Equity Securities and Use of Proceeds |
None.
| Item 3. | Defaults Upon Senior Securities |
None.
44
| Item 4. | Mine Safety Disclosures |
Not applicable.
| Item 5. | Other Information |
None.
| Item 6. | Exhibits |
45
Exhibit Index
| Exhibit Number |
Exhibit Description | |
| 3.1 | Articles of Restatement of the Registrant, incorporated by reference to Exhibit 3.1 to the Quarterly Report on Form 10-Q (File No. 001-33097), filed April 30, 2012. | |
| 3.2 | Bylaws of the Registrant, incorporated by reference to Exhibit 3.2 to the Registration Statement on Form S-11 (File No. 333-106024), filed June 11, 2003. | |
| 3.3 | First Amendment to Bylaws of the Registrant, incorporated by reference to Exhibit 99.1 of the Registrant’s Current Report on Form 8-K (File No. 001-33097), filed July 10, 2007. | |
| 4.1 | Form of Certificate for Common Stock of the Registrant, incorporated by reference to Exhibit 4.1 Pre-Effective Amendment No. 2 to the Registrant’s Registration Statement on Form S-11 (File No. 333-106024), filed August 8, 2003. | |
| 4.2 | Form of Certificate for 7.75% Series A Cumulative Redeemable Preferred Stock of the Registrant, incorporated by reference to Exhibit 4.1 of the Registrant’s Form 8-A12G (File No. 000-50363), filed January 19, 2006. | |
| 4.3 | Form of Certificate for 7.50% Series B Cumulative Redeemable Preferred Stock of the Registrant, incorporated by reference to Exhibit 4.2 of the Registrant’s Form 8-A12B (File No. 001-33097), filed October 19, 2006. | |
| 4.4 | Form of Certificate for 7.125% Series C Cumulative Term Preferred Stock of the Registrant, incorporated by reference to Exhibit 4.4 of the Registrant’s Current Report on Form 8-A12B (File No. 001-33097), filed January 31, 2012. | |
| 10.1 | Credit Agreement, dated as of August 7, 2013, by and among Gladstone Commercial Limited Partnership, the Registrant, each of the financial institutions initially a signatory thereto together with their successors and assignees and KeyBank National Association, incorporated by reference to Exhibit 10.1 of the Registrant’s Current Report on Form 8-K (File No. 001-33097), filed August 9, 2013. | |
| 10.2 | Unconditional Guaranty of Payment and Performance, dated as of August 7, 2013, by the Registrant, AL13 Brookwood LLC, CMS06-3 LLC, EI07 Tewksbury MA LLC, NJT06 Sterling Heights MI LLC, RB08 Concord OH LLC, DBPI07 Bolingbrook IL LLC, RCOG07 Georgia LLC, APML07 Hialeah FL LLC for the benefit of KeyBank National Association, incorporated by reference to Exhibit 10.2 of the Registrant’s Current Report on Form 8-K (File No. 001-33097), filed August 9, 2013. | |
| 11 | Computation of Per Share Earnings from Operations (included in the notes to the unaudited financial statements contained in this Report). | |
| 12 | Statements re: computation of ratios (filed herewith). | |
| 31.1 | Certification of Chief Executive Officer pursuant to Section 302 of the Sarbanes-Oxley Act of 2002 (filed herewith). | |
46
| 31.2 | Certification of Chief Financial Officer pursuant to Section 302 of the Sarbanes-Oxley Act of 2002 (filed herewith). | |
| 32.1 | Certification of Chief Executive Officer pursuant to Section 906 of the Sarbanes-Oxley Act of 2002 (furnished herewith). | |
| 32.2 | Certification of Chief Financial Officer pursuant to Section 906 of the Sarbanes-Oxley Act of 2002 (furnished herewith). | |
| 101.INS*** | XBRL Instance Document | |
| 101.SCH*** | XBRL Taxonomy Extension Schema Document | |
| 101.CAL*** | XBRL Taxonomy Extension Calculation Linkbase Document | |
| 101.LAB*** | XBRL Taxonomy Extension Label Linkbase Document | |
| 101.PRE*** | XBRL Taxonomy Extension Presentation Linkbase Document | |
| 101.DEF*** | XBRL Definition Linkbase | |
| *** | The following financial information of the Registrant is included for the three months ended September, 30, 2013, formatted in XBRL (eXtensible Business Reporting Language): (i) Condensed Consolidated Balance Sheets, (ii) Condensed Consolidated Statements of Operations, (iii) Condensed Consolidated Statements of Cash Flows and (iv) Notes to Condensed Consolidated Financial Statements. |
Pursuant to Rule 406T of Regulation S-T, the Interactive Data Files on Exhibit 101 hereto are deemed not filed or part of a registration statement or prospectus for purposes of Sections 11 or 12 of the Securities Act of 1933, as amended, are deemed not filed for purposes of Section 18 of the Securities and Exchange Act of 1934, as amended, and otherwise are not subject to liability under those sections.
47
Pursuant to the requirements of the Securities Exchange Act of 1934, the registrant has duly caused this report to be signed on its behalf by the undersigned thereunto duly authorized.
| Gladstone Commercial Corporation | ||||||
| Date: November 4, 2013 | By: | /s/ Danielle Jones | ||||
| Danielle Jones Chief Financial Officer and Treasurer | ||||||
| Date: November 4, 2013 | By: | /s/ David Gladstone | ||||
| David Gladstone Chief Executive Officer and Chairman of the Board of Directors | ||||||
48